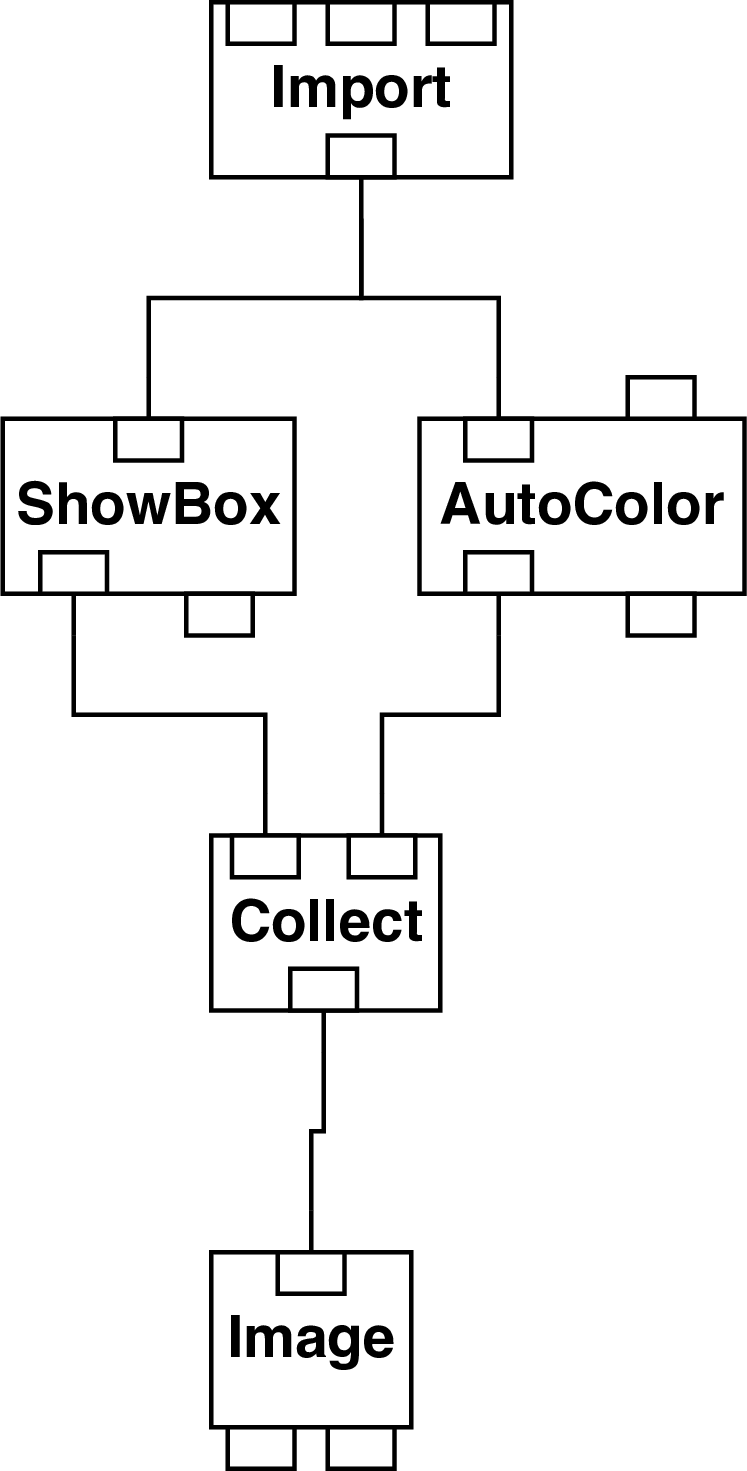
Figure 14: Network to display three-dimensional particle dataset.
| file: | particle.net |
| example data file: | particle.general |
This network displays three-dimensional particle data. Each point is shown in its correct relative position inside a set of axes representing a bounding box just enclosing the dataset. Note however that the position of each point within the plot is necessarily ambiguous. Each point is shown as a dot and coloured according to the data component of the field.
The network is shown in Figure 14.
Module ‘ShowBox’ extracts the bounding box of the data set. ‘AutoColor’ generates a plot showing the positions of each point in the dataset and colours each point according to the value of its data component. ‘Collect’ combines the bounding box and plot.