The following message should appear on your command terminal:
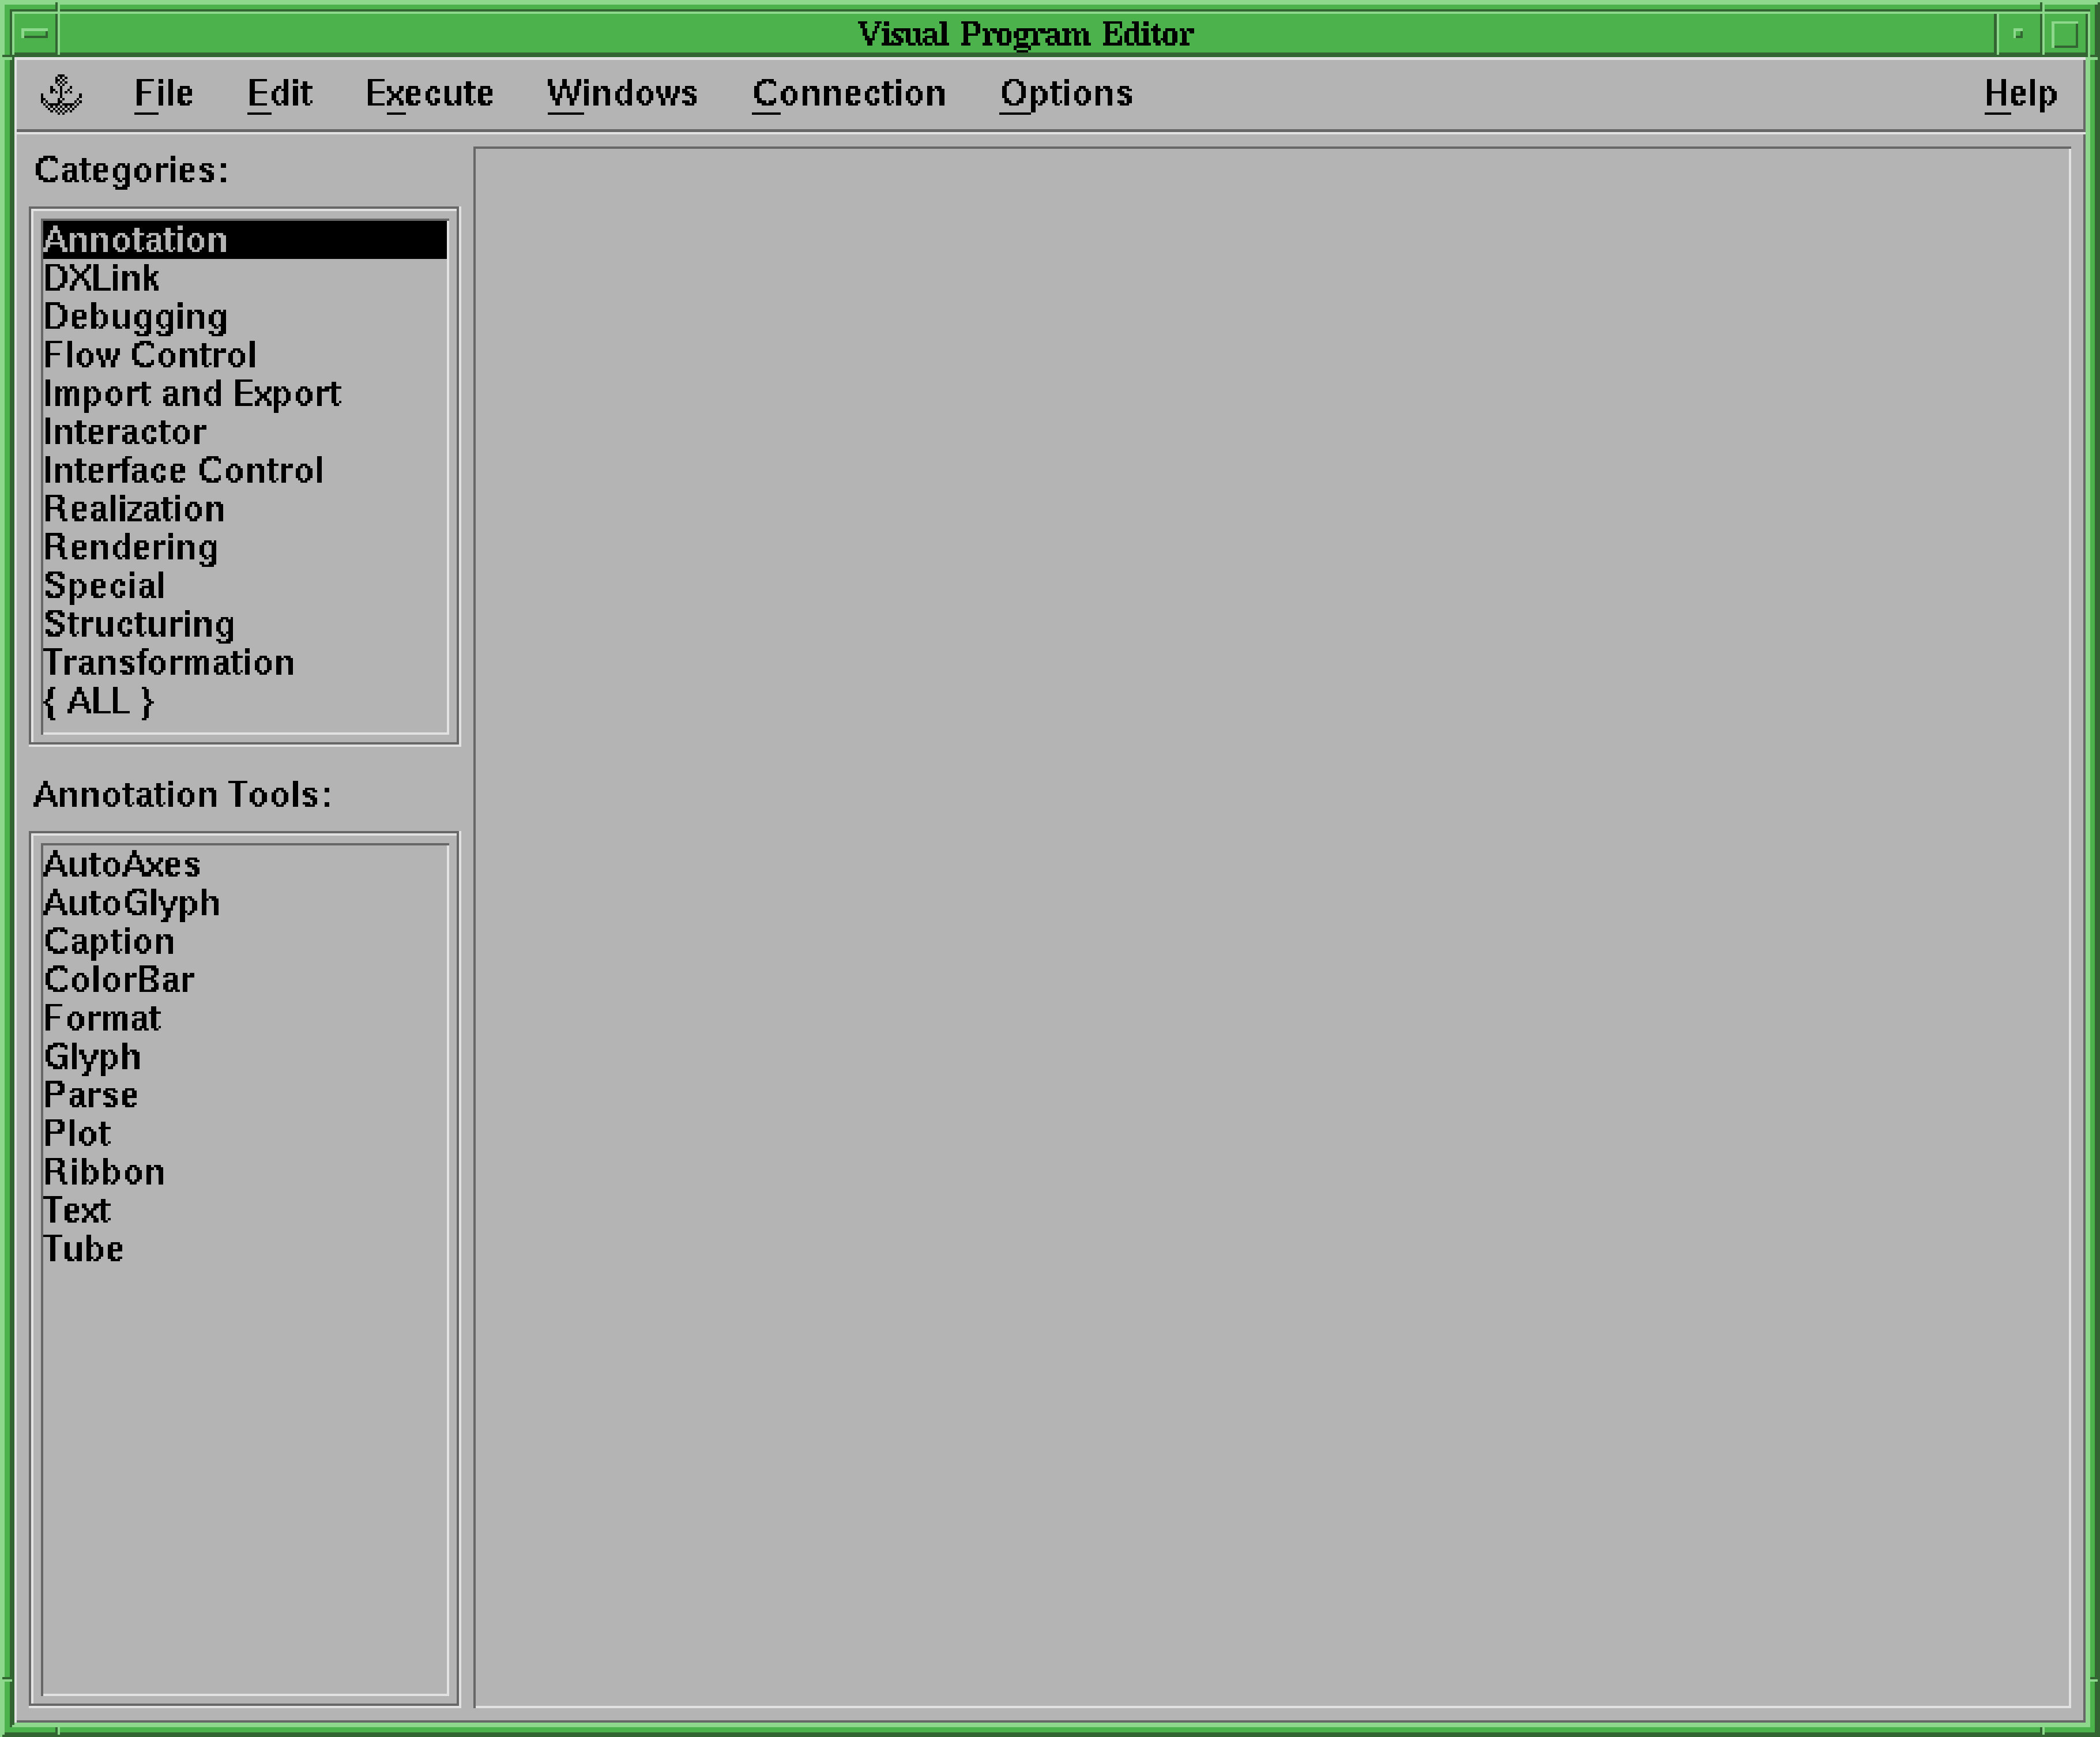
and a new window similar to Figure (1) should appear.
- The large blank area is the canvas where the network will be constructed.
- A DX network consists of modules, represented by icons, each performing some
function. The collection of modules is divided into categories of similar modules.
On the left hand side of the VPE are two boxes containing lists of items. The top
box, labelled ‘Categories:’, lists all the different categories of modules. The current
category is highlighted (it is ‘Annotation’ in Figure (1)). The lower box, labelled
‘Annotation Tools’, shows all the modules in the current category.
To choose another category simply click on the category required. The new category will be highlighted and both the label and the contents of the lower box will be changed to reflect the new choice.
- (a)
- select the appropriate category, so that the required module appears in the lower box,
- (b)
- click on the required module in the lower box, and it will be highlighted,
- (c)
- move the cursor to the desired position in the canvas and click again. The module will appear as a rectangular icon (see, for example, Figure 3).
- (a)
- click in the body of the module and hold down the leftmost mouse button,
- (b)
- move the cursor to the new position (continuing to hold down the mouse button),
- (c)
- release the mouse button.
- (a)
- click in the body of the module. It should appear highlighted, with a white bar above and below it,
- (b)
- choose the ‘Delete’ option from the ‘Edit’ menu and the module should disappear from the canvas.
- The tabs along the top represent inputs to the module.
- The tabs for mandatory inputs are coloured a brighter shade of green; optional (or defaulted) inputs are the same colour as the body of the icon.
- The tabs along the bottom represent outputs.
In DX data can only flow from an output tab to an input tab. An input tab can only be fed by one output tab. However, an output tab can feed an arbitrary number of input tabs.
- (a)
- click on the output tab and hold the leftmost mouse button down,
- (b)
- move the cursor to the input tab, continuing to hold the mouse button down,
- (c)
- release the mouse button.
A line should be drawn from the output to the input tab (not all input and output types are compatible; if the tabs are not compatible DX will not connect them with a line).
- (a)
- click on the input tab and hold down the leftmost mouse button,
- (b)
- move the cursor to a blank portion of the canvas,
- (c)
- release the mouse button, and the connection will vanish.
- (a)
- double-click on the module for which an input value is to be set,
- (b)
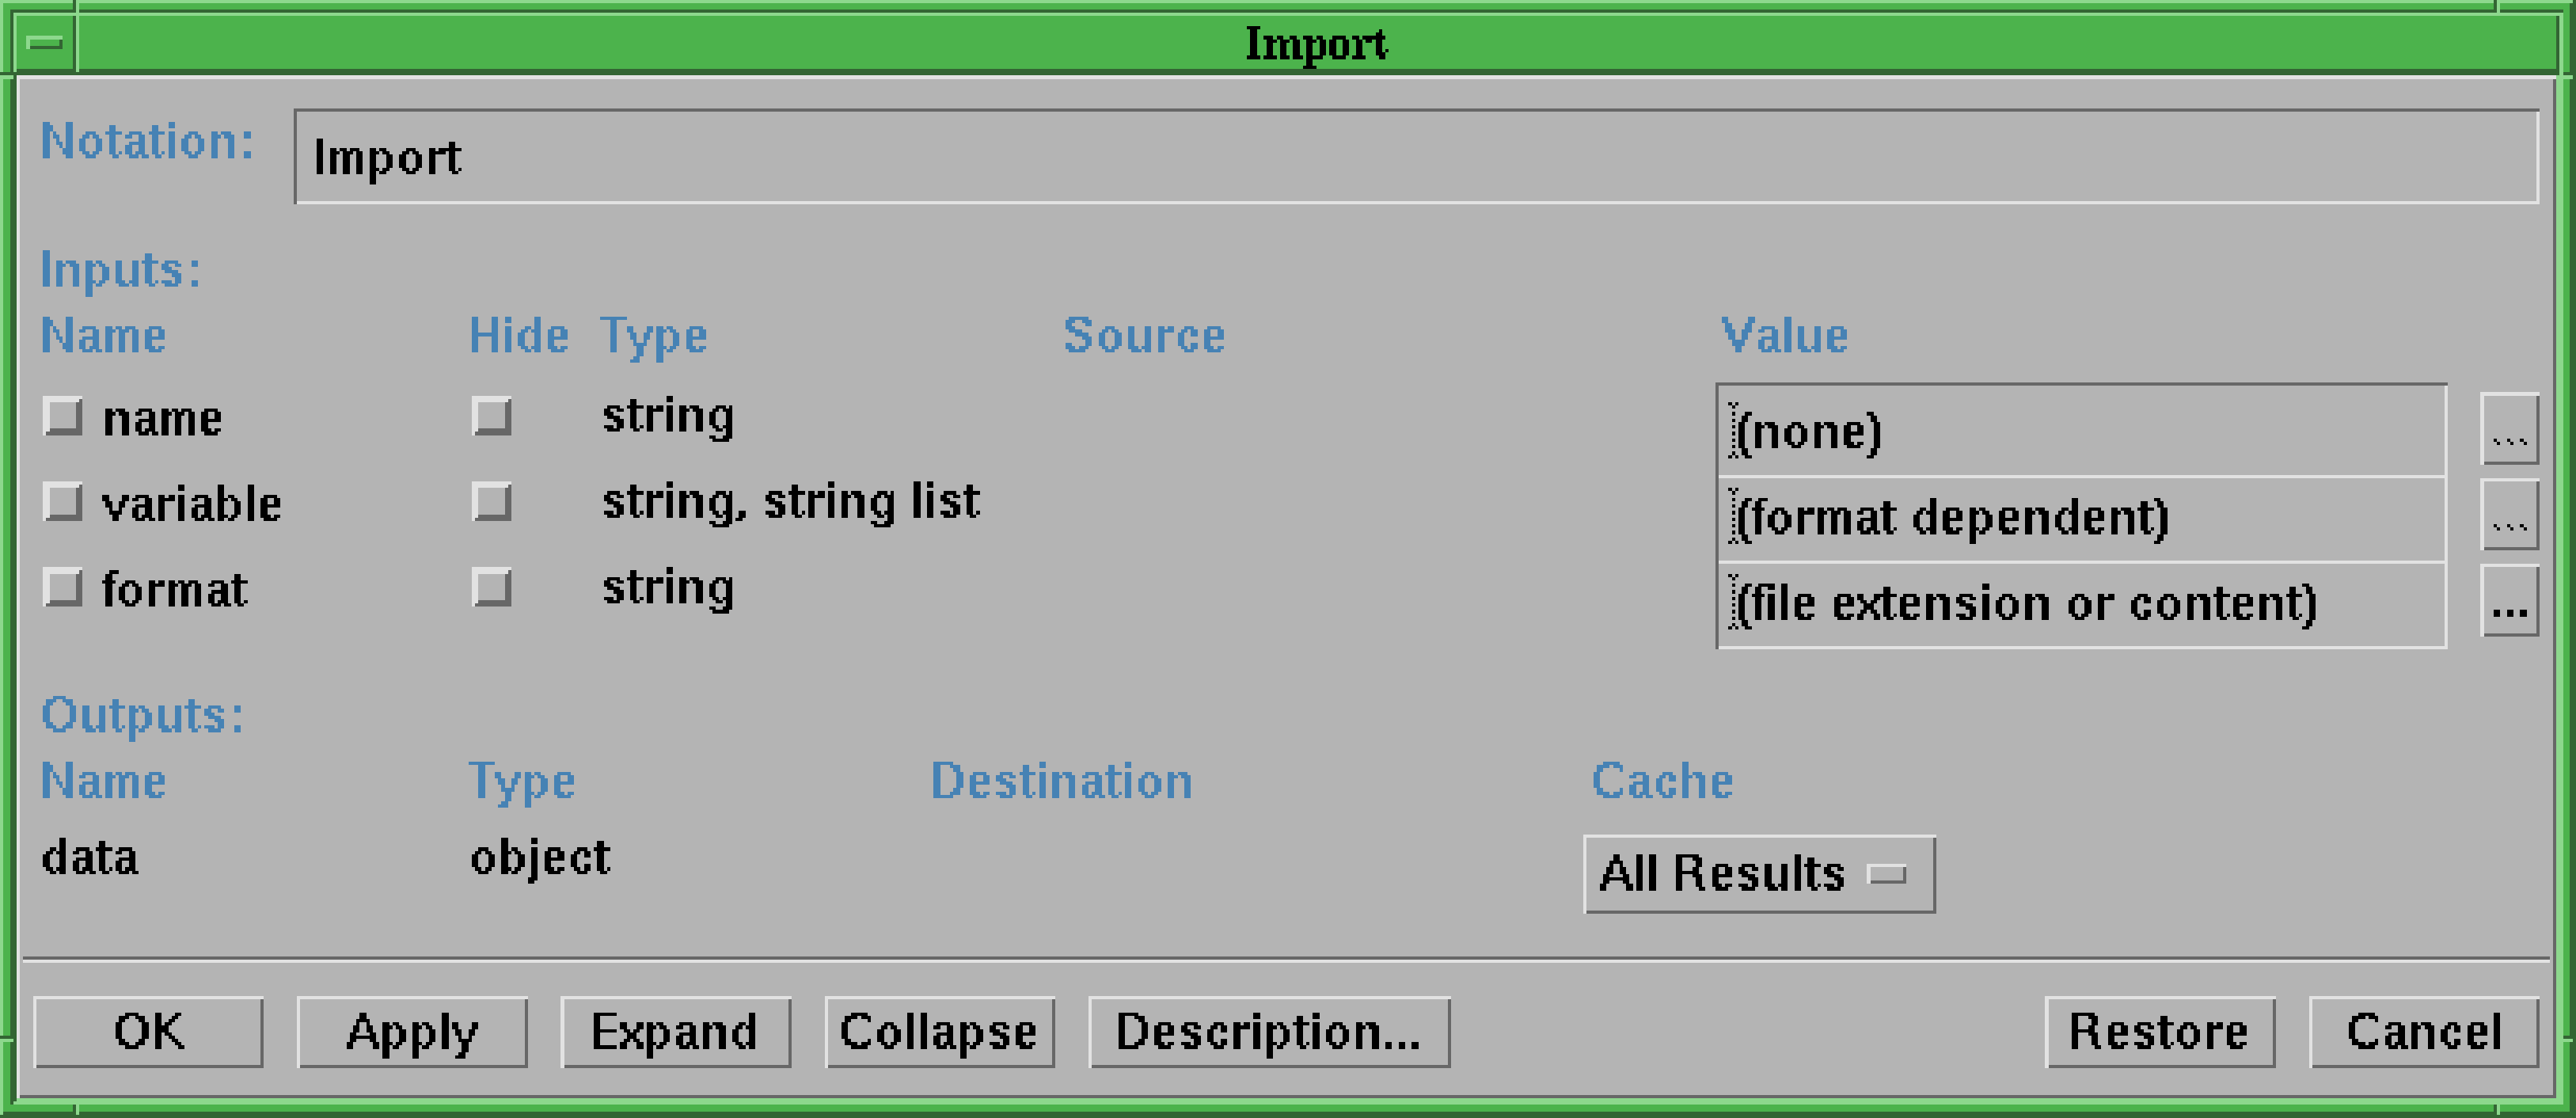
- a new window, called the configuration window, should appear, showing the
commonly used inputs for the module. Figure 2 shows this window for the ‘Import’
module,
- (c)
- each line of the ‘Inputs’ section of the window corresponds to a separate input; their names are listed on the right hand side. For module ‘Import’ the inputs are ‘name’, ‘variable’ and ‘format’,
- (d)
- click on the ‘Value’ box for the chosen input,
- (e)
- hold down the leftmost mouse button and drag it over the existing value, so that the existing value is highlighted,
- (f)
- type in the new value,
- (g)
- hit return (do not forget this step),
- (h)
- after you have hit return DX will display the value that you have entered, inside the box, in double quotation marks,
- (i)
- repeat the procedure until all the required inputs have been set, then click on the ‘OK’ button.
By default only the commonly used inputs for a module are shown. To show all the inputs (and outputs) click on the ‘Expand’ button.
- (a)
- click on the ‘Help’ menu in the top right hand corner of the VPE (see Figure (1)),
- (b)
- choose menu-item ‘Context-Sensitive Help’; the mouse pointer will change to a ‘?’,
- (c)
- position the pointer over either the required module on the canvas or the name of the module in the list in the bottom left hand corner of the VPE, and click,
- (d)
- another window containing a detailed description of the module will appear. Note that this information is formatted as hypertext, with links being indicated by a box drawn around the linked text. Simply click inside the box to follow the link,
- (e)
- when you have finished perusing the text simply click on the ‘Close’ button.
There are two ways to create the network. The first is to find the three modules, position them on the canvas and join them as shown. The second is to read in a prepared copy of the network from a file. For the second option proceed as follows.
- (a)
- Select ‘Open Program’ from the ‘File’ menu.
- (b)
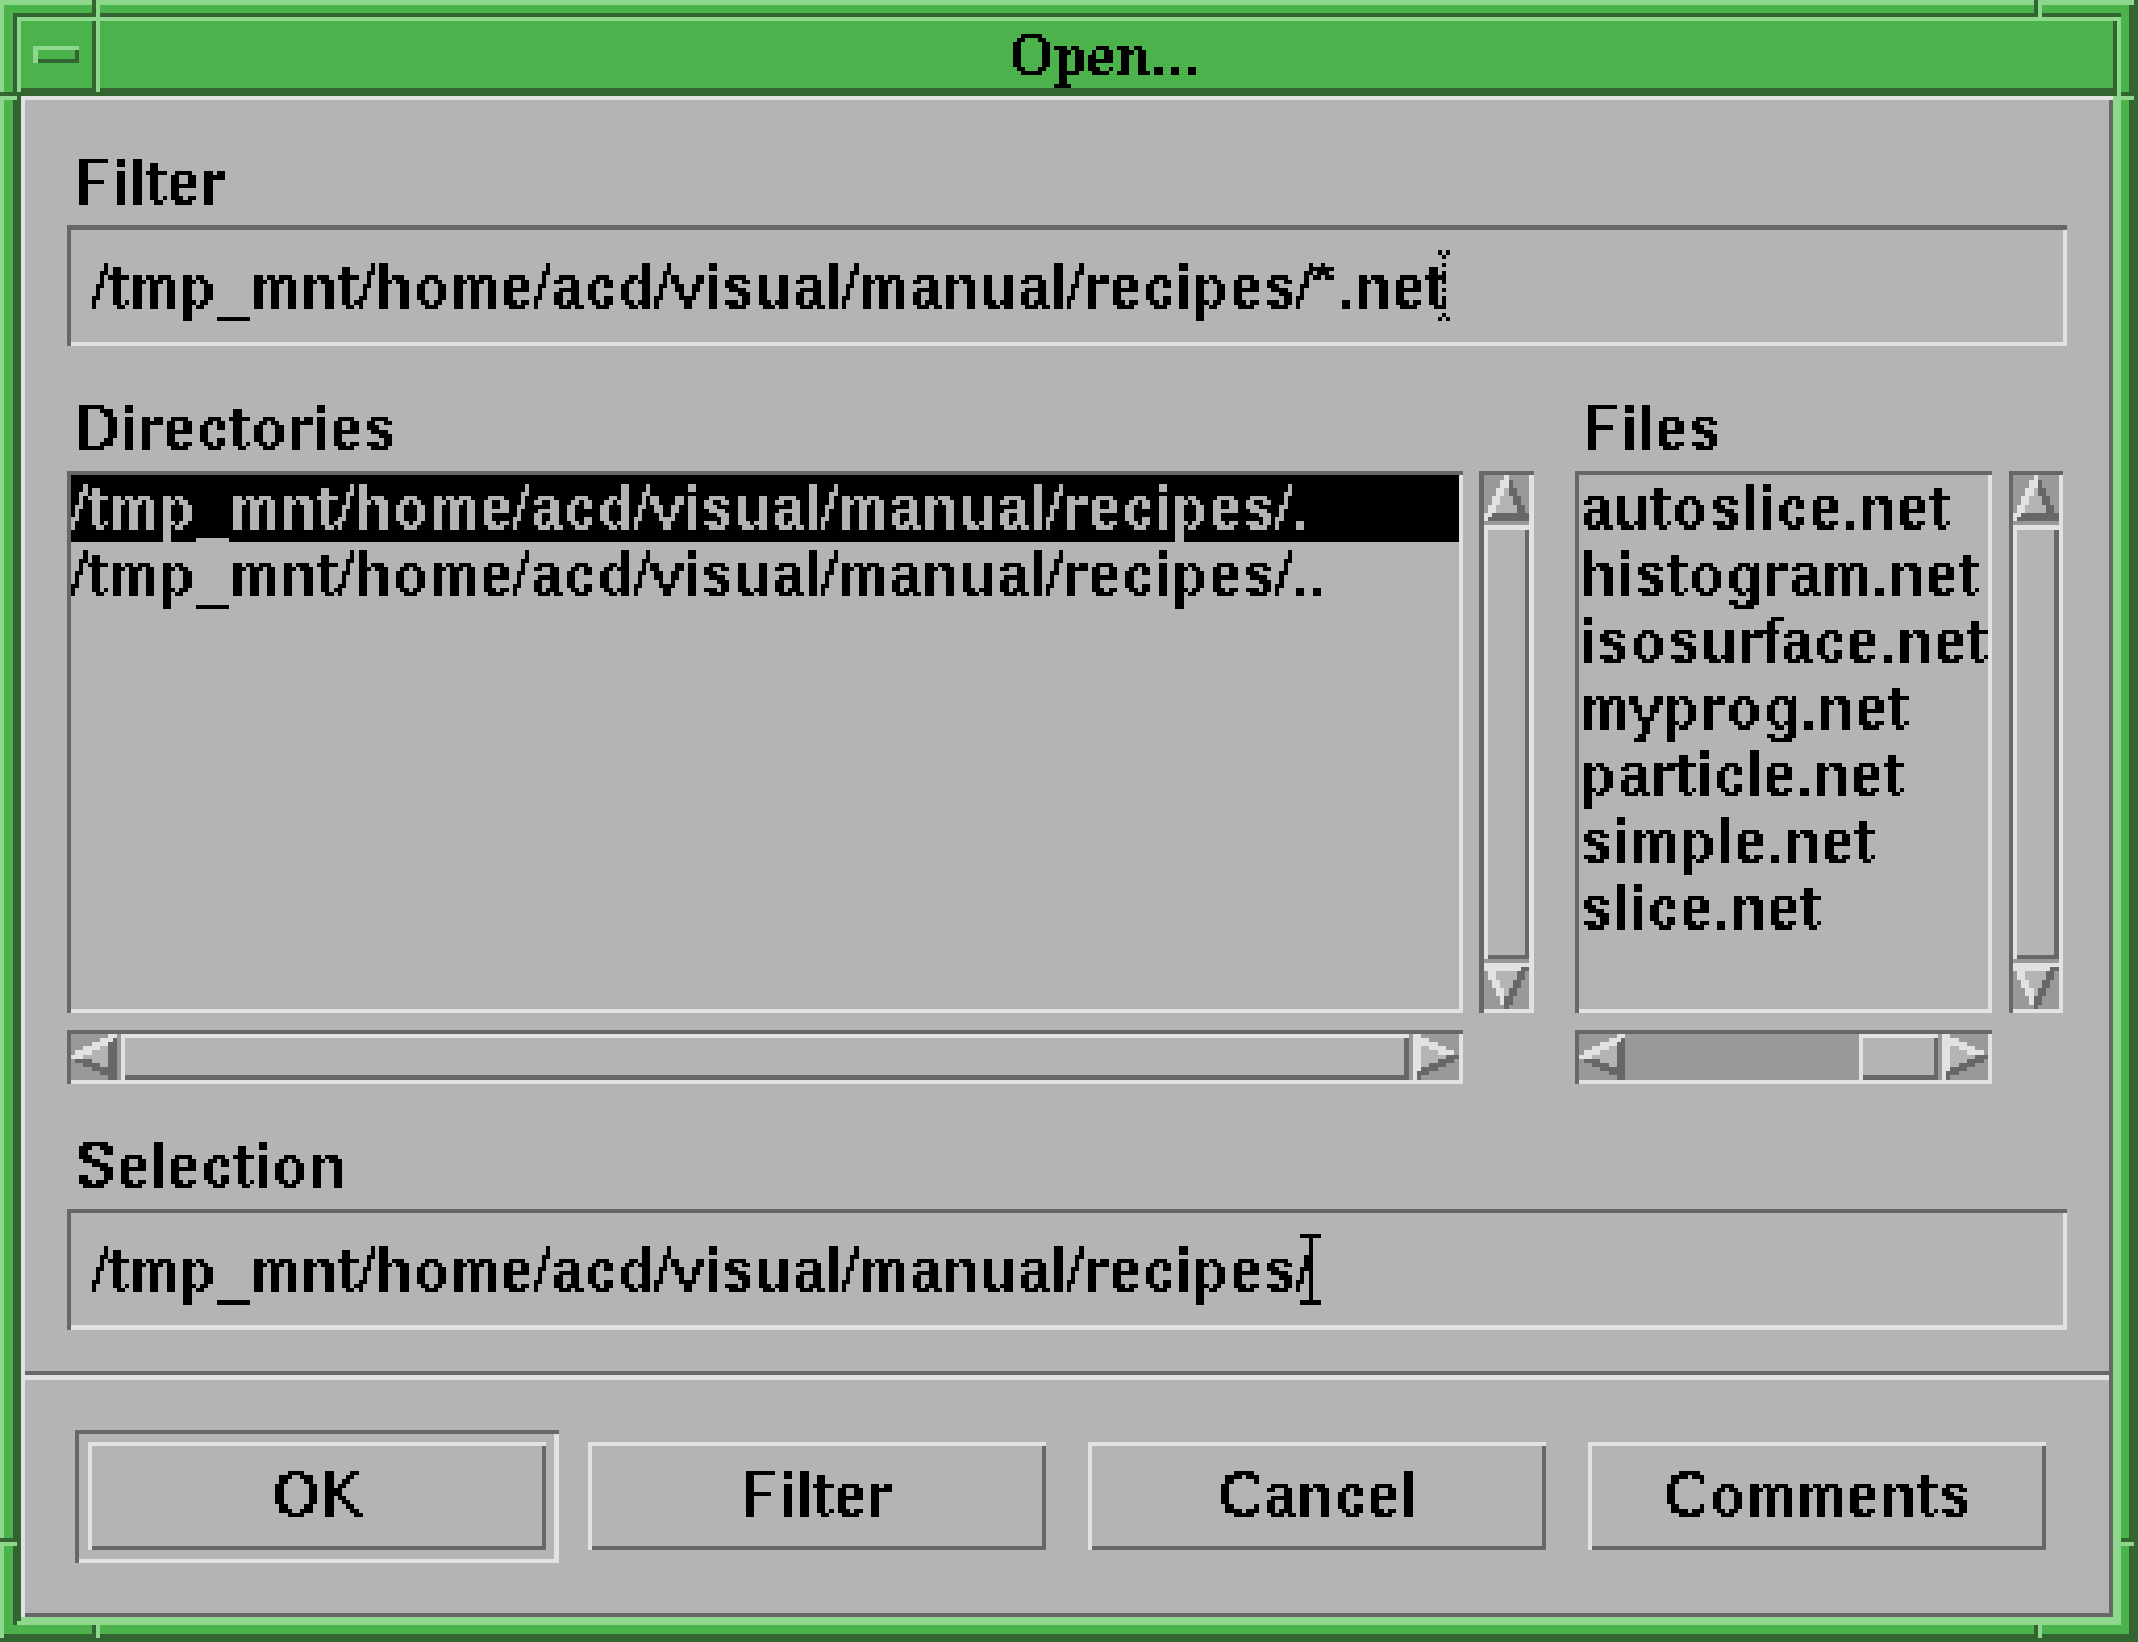
- The ‘Open…’ window appears, as shown in Figure 4. You will use this window to
specify the network file.
- (c)
- The ‘Filter’ box at the top of the window controls the files available for selection. It contains
a wild-card file expression and all the files which match the expression are available for
selection. Click on this box and enter:
$STARLINK_DIR/examples/sc2A list of networks should appear in the ‘Files’ box on the right hand side of the window. By convention DX networks have file type ‘
.net’. - (d)
- Click on file ‘
simple.net’ in this box. The full file name and directory specification of thesimplenetwork should now appear in the ‘Selection’ window. - (e)
- Click on the ‘OK’ button. The ‘Open…’ window closes and the network is loaded onto the canvas.
The network is now ready for use.
- Import
- read in the field to be displayed from an external file,
- AutoColor
- colour a field ready for display, so that a range of values in the field map to a range of colours,
- Image
- display a field. In this network ‘Image’ will produce a volume rendering of a gridded dataset. However, it can accept various other sorts of input to produce different sorts of display.


