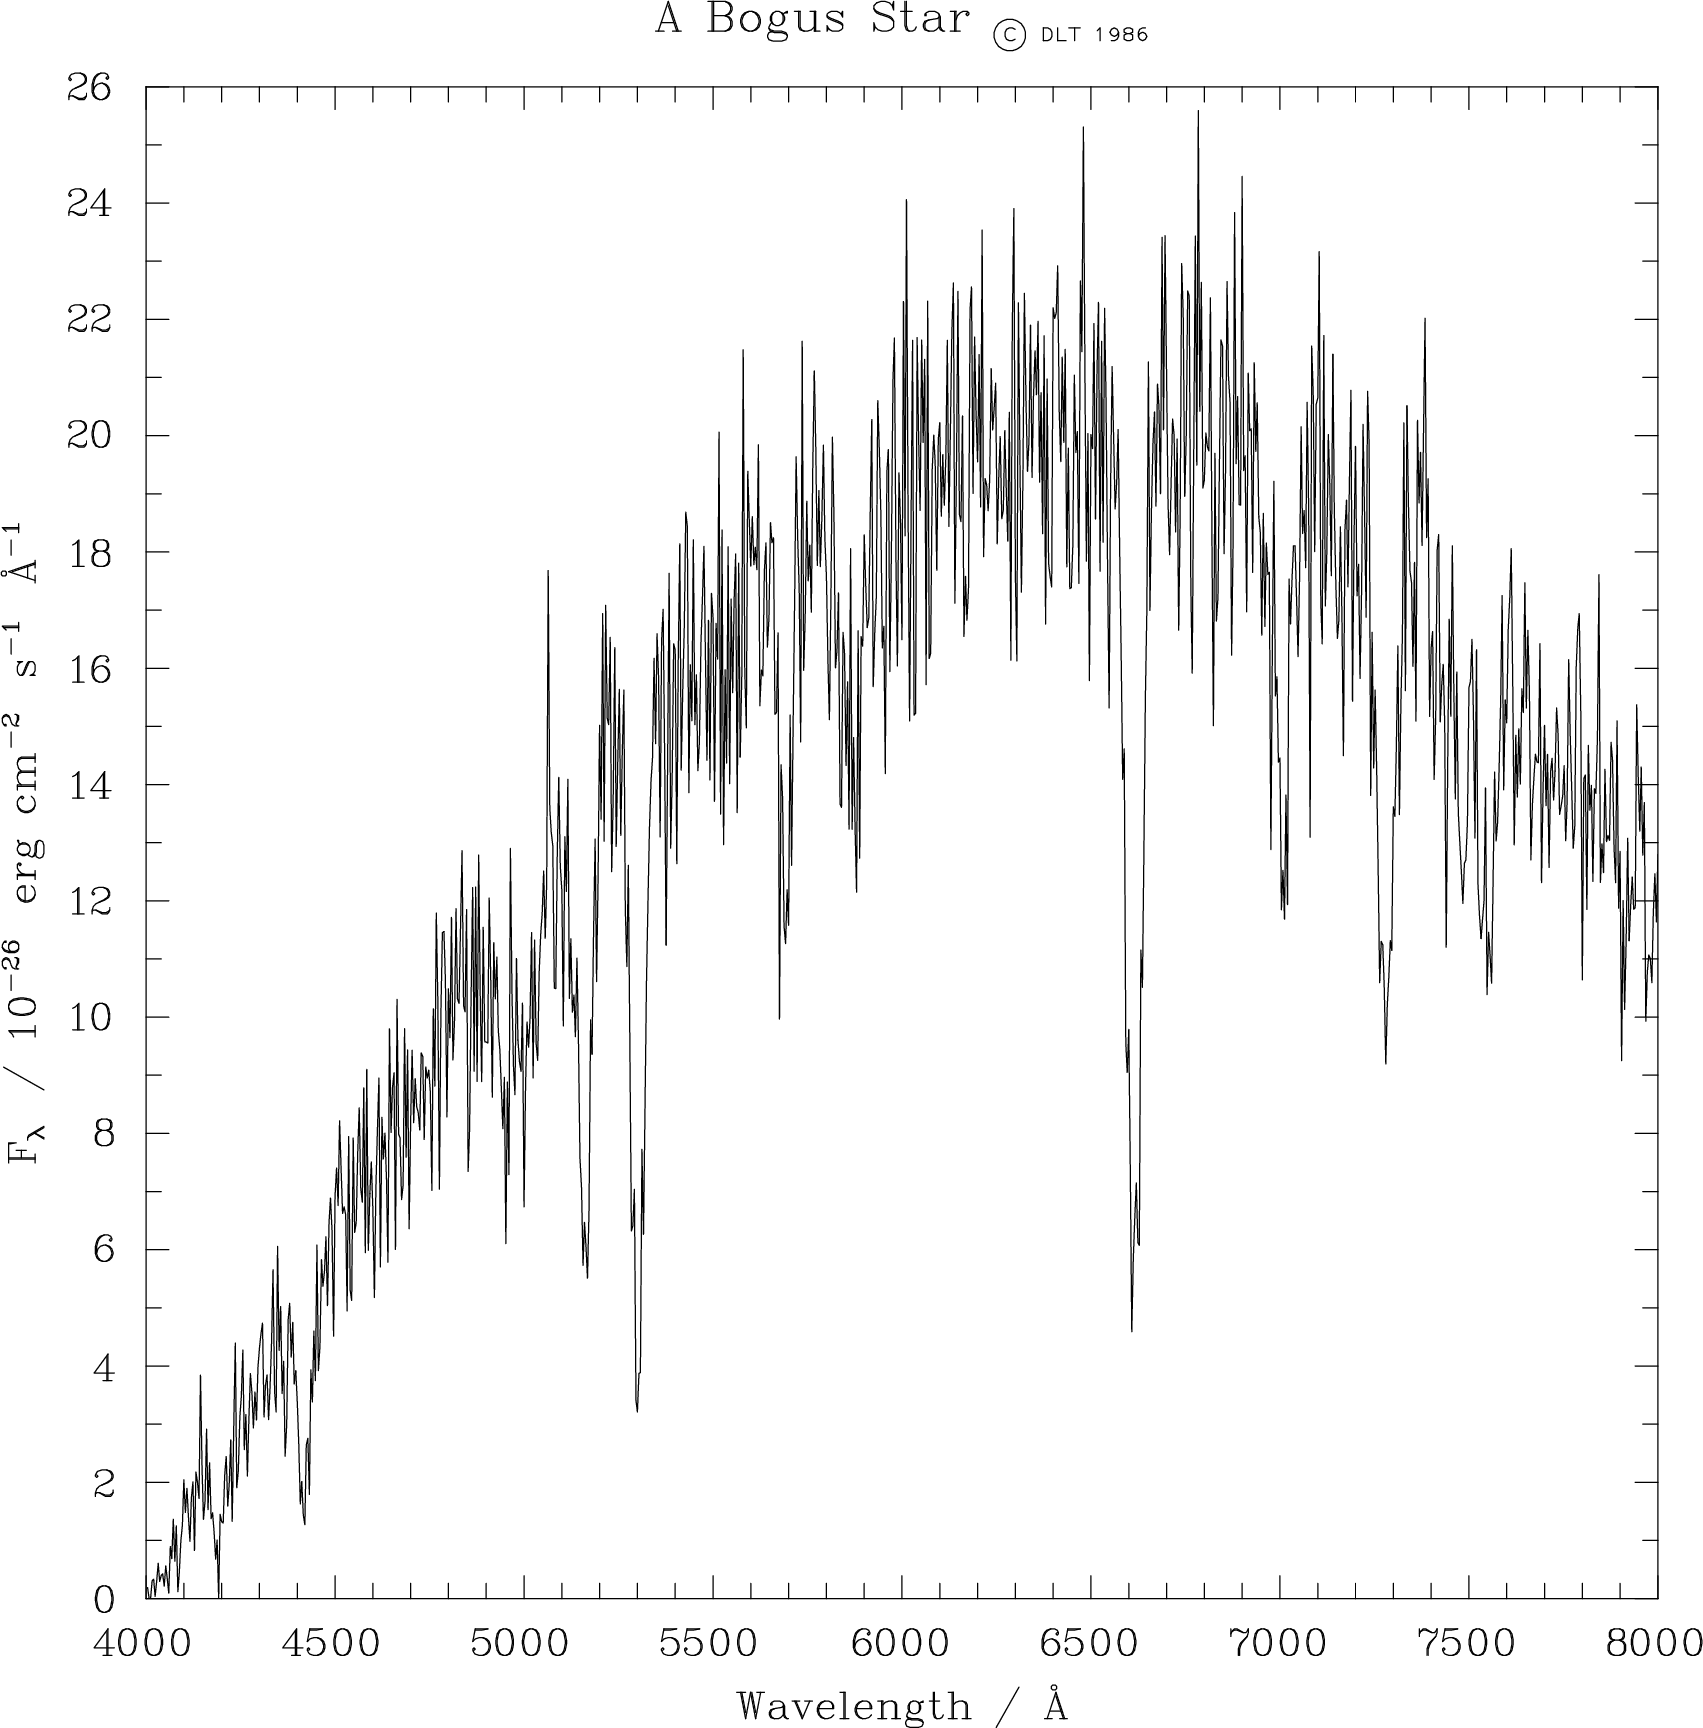
The following pages contain a listing of the Fortran source for a program called XYPLOT, plus a
sample input file and the plot it produces. As well as demonstrating several of the facilities described
in this document, XYPLOT may be useful as a template for developing other simple graphics utilities,
and can be used in its own right as a convenient way of producing a presentable plot of a list of (x,y)
data. The Fortran source may be found in the file NCAR_DIR:XYPLOT.FOR on VAX/VMS
and in the archive /star/starlink/lib/snx/examples/snx-examples_source.tar on
UNIX. On VAX/VMS, this program may be compiled, linked and run using the command
sequence
On UNIX, this program may already be installed in directory /star/bin/examples/snx. If it has been
deinstalled and removed to save space, you can copy the entire source directory to a scratch
dircetory, and with the SYSTEM environment variable set appropriately, build and run it
thus:
XYPLOT reads an input file and plots a graph. The input file consists of a sequence of
alphanumeric records, the first three of which are the labels (title, x-axis, y-axis) with the rest
each containing an (x,y) point (in free format). The example data may be found in the file
NCAR_DIR:XYPLOT.DAT on VAX/VMS and /star/bin/examples/snx/xyplot.dat on UNIX (if
installed). The resulting graph consists of a line joining the points in the order in which they are
given.
Notice that most of the program is devoted to reading in the data, and that the plotting itself requires just three calls – to open, plot and close respectively.
The reasons SNX_EZRXY expects you to do the SGS/GKS open and close rather than providing truly one-call plotting by doing them itself are:
The trade-off is fractionally less convenience versus greatly increased versatility.
The beginning of the file which was used to produce the graph on the next page is given below. Note the use of PWRITX function codes in the three label records; this assumes the program has been linked with the special version of the AGPWRT routine (see §3 and 7). Deliberately complicated example labels have been contrived; most real applications would require just plain text without PWRITX codes.
XYPLOT is a convenient tool for quickly debugging complicated label strings. With a text editor, set up a dummy input file consisting of the label string you want to try out, then two more arbitrary labels and two arbitrary data points. Run the XYPLOT program and inspect the x-axis label; if wrong, edit the data file and try again.
XYPLOT produced the following graph when the example input file given in the previous section was used. Further copies can be obtained by running XYPLOT and replying with the name of the example input file to the ‘Filename?’ prompt.
