Next Previous Up Contents
Next: Cube Navigation
Up: Plot Windows
Previous: Sky Axes Control
Cube Plot Window
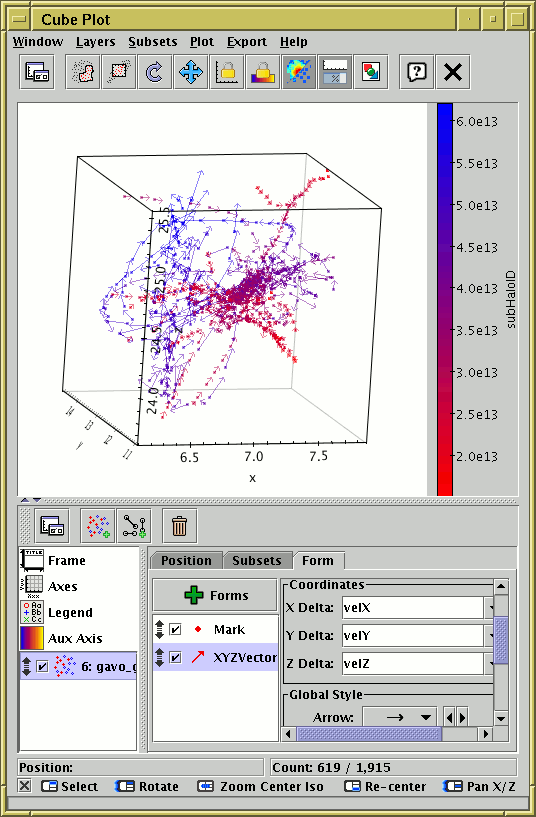
The Cube Plot ( )
plots 3-dimensional Cartesian positions in a 3-d space.
)
plots 3-dimensional Cartesian positions in a 3-d space.
The positional coordinates are
X, Y and Z.
To control the direction and linear/logarithmic scaling of the axes,
see the Coords tab of the
Axes control.
The cube plot offers the following plot controls:
Note that use of the
Auto,
Density and
Weighted
shading modes can be confusing in 3 dimensions with multiple datasets.
This is because pixels based on density along a line of sight are not
located at any point on that line, so shaded pixels can't appear
at the "right" place in the 3-d space. The same applies to a lesser
extent with contours. They work fine with a single dataset though.
See the Window Overview
for features common to all plotting windows.
The following subsections describe
navigation and
axis configuration.
Next Previous Up Contents
Next: Cube Navigation
Up: Plot Windows
Previous: Sky Axes Control
TOPCAT - Tool for OPerations on Catalogues And Tables
Starlink User Note253
TOPCAT web page:
http://www.starlink.ac.uk/topcat/
Author email:
m.b.taylor@bristol.ac.uk
Mailing list:
topcat-user@jiscmail.ac.uk
 Position Layer Control, with these form options:
 Pair Layer Control, with the following plot controls:


