Next Previous Up Contents
Next: Cube Plot Window
Up: Sky Plot Window
Previous: Sky Navigation
The Axes control ( ) for the
sky plot window has the following tabs:
) for the
sky plot window has the following tabs:
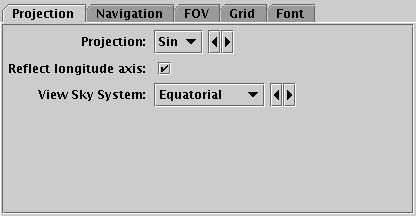
Projection tab of the sky Axes control
The Projection tab controls how the sky position
coordinates are projected onto the screen.
-
Projection
- Selects the sky projection to use.
The options are Sin;
Aitoff or Aitoff0 for Aitoff; and
Car or Car0 for Plate Carrée.
Sin is rotatable, the other two are essentially flat all-sky projections.
Car and Aitoff have longitude=0 at the center of the plot, while
Car0 and Aitoff0 have it at the left/right edge.
-
Reflect longitude axis
- Determines whether longitude increases left to right or right to left.
-
View Sky System
- Determines the sky coordinate system in which the data positions will
be viewed. This interacts with the
Data Sky System selected in the
Positions tab of the
table layer control
for data coordinates;
supplied data points are projected from the data system to the view
system before being plotted.
If you have (for instance) data in equatorial coordinates that you
want to view in galactic coordinates, then select the
Data Sky System as Equatorial and the View Sky System as Galactic.
If the data and view systems are the same, it's OK to leave both
as their defaults, even if they're not equatorial - the only
effect that the chosen Data and View sky systems has is from
the transformation between them.

Navigation tab of sky Axes control
The Navigation tab controls details of how the navigation
works.
It has the following option:
-
Zoom Factor
- Controls the factor by which each zoom action zooms the plot.
Moving this slider to the left/right makes the mouse more/less sensitive
(one wheel click or dragging a fixed distance has more/less zoom effect).
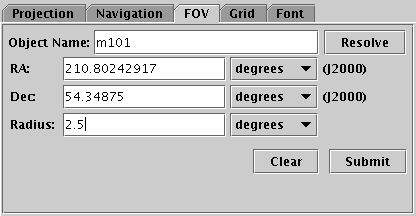
Field Of View tab of the sky Axes control
The FOV (Field Of View) tab allows you to
enter a sky position or object name and a radius and positions
the view at that region.
Filling in the fields and hitting Submit
will reposition the sky view, but not vice versa;
normal pan/zoom operations will not affect the content of this panel.
-
Object Name
- If you fill this in with the name of a celestial object and hit
the Resolve button, a Simbad query will execute
to fill in the RA and Dec fields
with its position.
-
RA/Dec
- J2000 positions of the required field centre.
These values can either be filled in by the object name resolution
as described above, or by hand.
-
Radius
- Gives the radius of the desired field of view.
-
Clear
- Clears the fields in this tab.
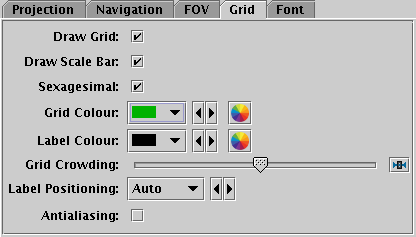
Grid tab of the sky Axes control
The Grid tab controls how the sky coordinate axes
appear.
-
Draw Grid
- If selected, grid lines will be drawn on the plot.
-
Draw Scale Bar
- If selected, a small annotated scale bar will usually be drawn
at the bottom left of the plot indicating the scale of the image
in degrees, minutes or seconds.
-
Sexagesimal
- If selected sky coordinate annotations of the grid will be in
sexagesimal format, otherwise in decimal degrees.
-
Grid Colour
- Selects the colour with which grid lines will be drawn.
-
Label Colour
- Selects the colour in which axis label text will be written.
-
Grid Crowding
- Use the slider to control how closely packed grid lines are
on the axes.
If you want to control the crowding separately on the two axes,
you can use the
SkyGrid layer control instead.
-
Label Positioning
- Controls whether and where the numeric annotations of the lon/lat
axes are put. The default option Auto usually does
the sensible thing, but other options exist to force labelling
internally or externally to the plot region, or to remove numeric
labels altogether.
-
Antialiasing
- Controls whether grid lines will be drawn antialiased
(smoothed) or not. This option does not affect exported plots.
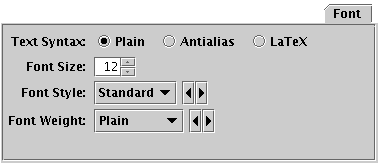
Font tab
The Font tab configures the font used for axis annotation.
It also affects some other things like the legend.
-
Text Syntax
- How to turn the text into characters on the screen.
Plain and Antialias both take the
text at face value, but Antialias smooths the characters.
Antialiased text usually looks nicer, but can be perceptibly slower to plot.
At time of writing, on MacOS antialiased text seems to be required to
stop the writing coming out upside-down for non-horizontal text.
LaTeX interprets the text as LaTeX source code
and typesets it accordingly.
-
Font Size
- Size of the font in points.
-
Font Style
- Style of the font.
-
Font Weight
- Whether the font is plain, bold or italic.
Next Previous Up Contents
Next: Cube Plot Window
Up: Sky Plot Window
Previous: Sky Navigation
TOPCAT - Tool for OPerations on Catalogues And Tables
Starlink User Note253
TOPCAT web page:
http://www.starlink.ac.uk/topcat/
Author email:
m.b.taylor@bristol.ac.uk
Mailing list:
topcat-user@jiscmail.ac.uk