
The POL-2 instrument is a linear polarimetry module for the Submillimetre Common User Bolometer Array-2 (SCUBA-2), a 10,000 bolometer camera on the JCMT [13] [2]. POL-2 in itself is not a detector—thus requiring SCUBA-2 and its detectors for operation. SCUBA-2 (and consequently POL-2) operates simultaneously at both 850 and 450 µm.


In polarimetric terms, light is conventionally described by the four Stokes parameters: , , , and .
is the total intensity; is the radiation linearly polarised in the direction parallel or perpendicular to the reference plane. is the radiation linearly polarised in the directions 45 to the reference plane; and is the circularly polarised radiation.
POL-2 is designed to characterise linear polarisation. The parameter, consequently, is not discussed further, with subsequent focus being only on , , and .
The linear Polarised Intensity (I) and polarisation angle () can be described as:
| (2.1) |
| (2.2) |
with Q and U related to the polarisation angle and the polarised intensity by:
| (2.3) |
| (2.4) |
where
| (2.5) |
| (2.6) |
where and are the measured values of and before correction for instrumental polarisation (IP) is applied. The IP correction is the product of the total intensity () and a factor ( or ) that varies with elevation but which is always smaller than 0.03.
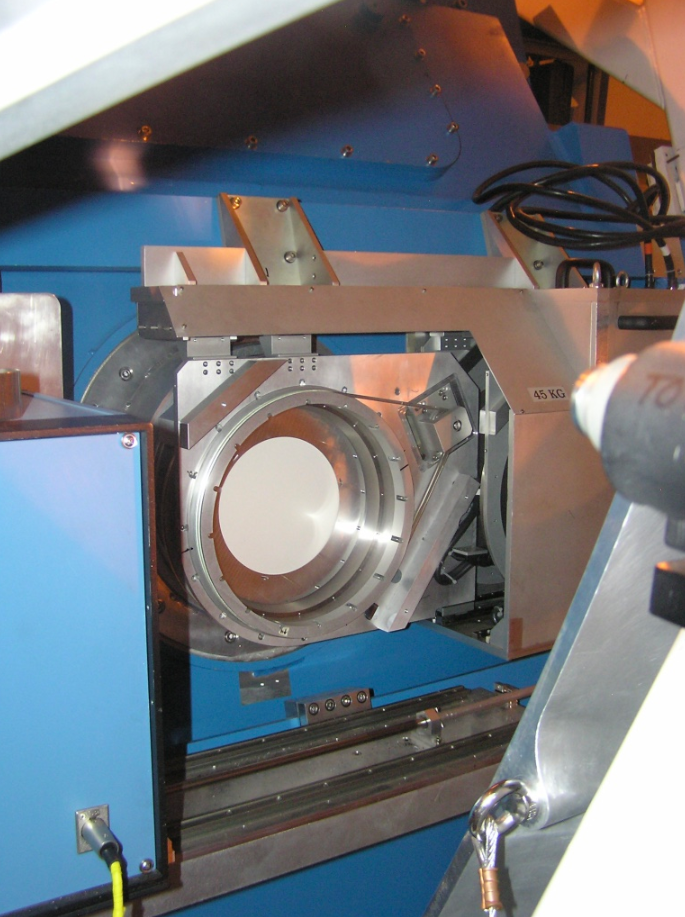
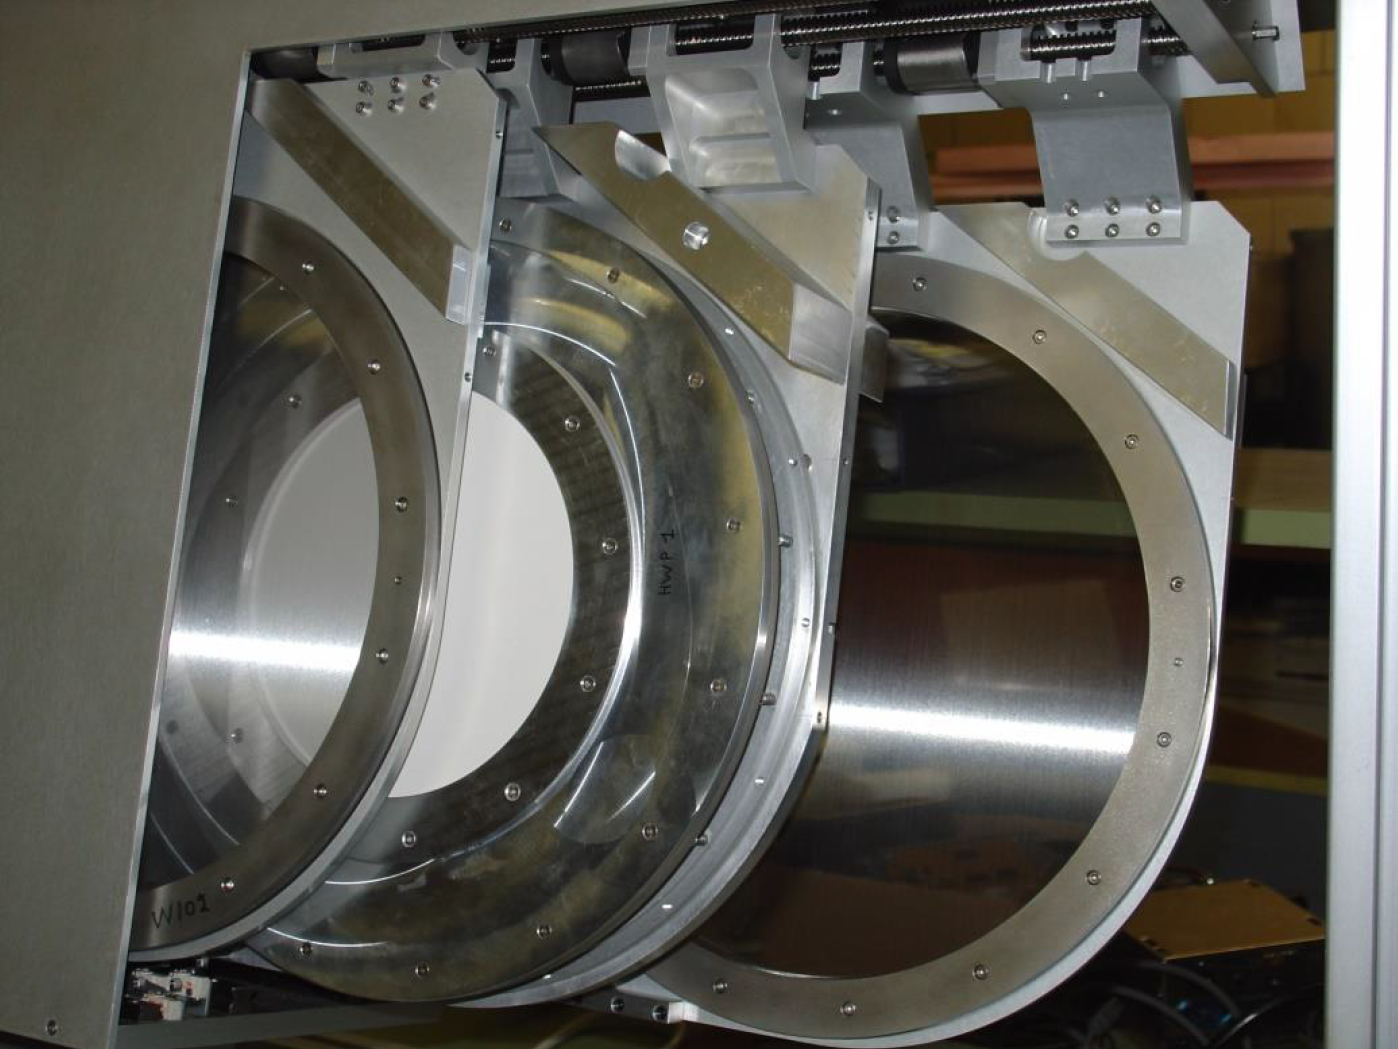
POL-2 is located in front of the window to the SCUBA-2 instrument (as is seen in Figure 2.1), and covers the full field of view of SCUBA-2. The POL-2 polarimeter uses three optical components that cover the full field of SCUBA-2:
These components can be seen in Figure 2.1. A schematic of POL-2 is given in Figure 2.2.

Rotating the HWP rotates any linearly polarised component of incoming radiation. The HWP rotates this incoming linear polarisation with twice the speed of the HWP angle () producing the effective analyser position (—as defined in the POLPACK documentation), such that:
| (2.7) |
The rotating linearly polarised component is transmitted or reflected by the grid, causing a modulation in the transmitted intensity. The amplitude of the polarised component transmitted by the polariser is cos() while the power is cos().

The radiation passing through the polarimeter is detected by SCUBA-2. The detected intensity () is a combination of both the unpolarised intensity () and the linearly polarised intensity ()1. This detected intensity can be described by:
| (2.8) |
with the above equation being in terms of the effective analyser angle, , and the angle of the polarisation (. This can also be expressed in terms of the the HWP angle ().
| (2.9) |
As described in the POL-2 commissioning document, the HWP is constructed from five individual synthetic sapphire layers approximately 0.9 mm thick and 200 mm in diameter. The transmission properties of sapphire are generally good at the SCUBA-2 wavelengths, but are dependent on the thickness and ambient temperature. The total effective transmission values of the HWP integrated across the 850 and 450 µm filter bands are about 86% and 57% respectively [18].
The HWP rotates the incoming linear polarisation with twice the speed of the wave plate angle. The HWP is typically rotated at 2 Hz, providing a fast modulation of any linear polarisation by 8 Hz (see Equation 2.9). The data acquisition rate is 175 Hz, yielding 20 samples per cycle. The atmosphere is stable on the order of 2 Hz and can be removed.


At the angular resolution of JCMT, planets such as Uranus should appear as unpolarised point sources. In practice, however, POL-2 observations of such sources exhibit a measurable level of polarisation—albeit typically less than 1.5% at 850 m. This is evidence that some part of the incoming astronomical radiation is being partially polarised by one or more of the components of the telescope/POL-2/SCUBA-2 that are in the light path. This polarisation is referred to as "Instrumental Polarisation" (IP).
In order to establish the true and from an astronomical source, it is necessary to correct for this effect. For the case of a low degree of polarisation in the incoming radiation and a low degree of IP, the following expressions provide good approximations to correct the measurement for the effects of the IP:
| (2.10) |
| (2.11) |
where and are the measured values for a single bolometer sample at some point on the sky. and are the true (corrected) values, is the astronomical total intensity at the same point on the sky (i.e. the total intensity after removal of the sky and electronic backgrounds) and and are factors that may vary slowly with focal plane position and/or azimuth and elevation.
IP correction of a POL-2 map therefore requires the use of a total intensity map of the same area of the sky. This total intensity map is referred to as the IP reference map, and can now usually be derived from normal POL-2 observations as part of the standard data reduction process, obviating the need for an additional non-polarimetric reference map observation.
Whilst flat mirrors or surfaces will produce a small, constant polarisation across the beam, curved mirrors and other structures (for example the secondary mirror supports) will produce more complex polarisation effects, and these may distort the beam shape. Side-lobes can often show up with strong (typically 10–20%) polarisation but these effects are usually far from the main-beam. Calculations of typical antenna patterns for symmetrical Cassegrain antennas have not predicted strong polarisation in the main beam.
The JCMT IP footprint is stronger than might be expected from the above considerations above (though typically less than 1.5% of the total intensity), and has the following distinctive features:
The dominant source of IP at the JCMT is the woven Goretex membrane, used as a wind blind. This membrane introduces both losses and polarisation. This effect is elevation dependent.
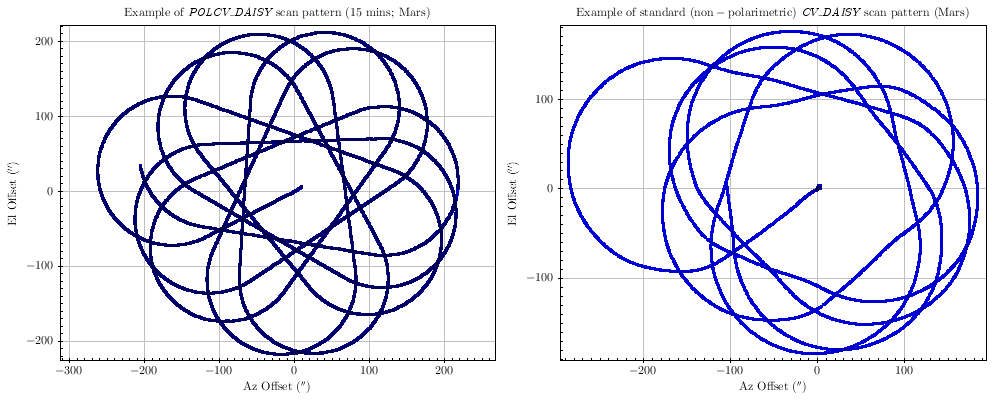
The standard POL-2 observing mode, POLCV_DAISY, is a “scan and spin” mode, in which the telescope is moving continuously in a Daisy-type pattern while the HWP spins.
The POLCV_DAISY scan mode is similar to the established Daisy scan mode routinely used for non-polarimetric SCUBA-2 observations of point-like or compact sources. However, it is slightly altered to allow for a slower telescope scanning speed.

The telescope must scan slowly enough to obtain sufficient data at each point on the sky to allow good and values to be determined. The current commissioned scan pattern has a size of 200′′ and a scan speed of 8′′/s. The data reduction splits the data stream into short segments and determines a pair of and values from each segment.
The length of each data segment is defined primarily by the time taken for the HWP to make a single rotation
(0.5 s). The scan speed of 8′′/s was chosen to make this correspond to 4′′ on the sky. The default pixel size
provided by pol2map is 4′′ at both 850 and 450 µm.
The standard POLCV_DAISY scan parameters are given in Table 2.1 and shown in Figure 2.7.
| Parameter | Value |
| Half-wave plate-rotation frequency | 2 Hz |
| Antenna scanning speed | 8′′/s |
| R (map pattern radius)† | 133′′ |
| R (turn radius) | 99′′ |
| R (nominal avoidance radius) | 77′′ |

SCUBA-2 is the detector instrument for POL-2, and as such, the raw data format of POL-2 data is the same as a typical SCUBA-2 observation. The sequence for both observations is:
The SEQTYPE
keyword in the FITS header may be used to identify the nature of each scan. When a user searches for raw data
from the CADC archive http://www3.cadc-ccda.hia-iha.nrc-cnrc.gc.ca/jcmt/all of the data types listed above
will be returned.
Critically, the INBEAM keyword in the FITS header may be used to identify if POL-2 is in the beam, and hence
differentiate between SCUBA-2 and POL-2 observations.
Shown below is an incomplete list of the raw files for a single sub-array (in this case s8a) for a short POL-2 observation. The first scan is the dark noise frame, and the second and last scans are the flat-field observations, which occur after the shutter opens to the sky at the start of the observation and closes at the end (note the identical file size); all of the scans in between are science scans.
The SCUBA-2 data-acquisition (DA) system writes out a data file every 30 seconds; each of which contains 22 MB of data. The final file listed above is a flat-field scan, which will usually be smaller (7.9 MB in this example). Note that all of these files are written out eight times, once for each of the eight sub-arrays.
The main data array in each NDF is a cube, with the first two dimensions corresponding to bolometer columns and rows within a sub-array, and the third dimension corresponding to time slice index (sampled at roughly 200 Hz).
A standardised file naming scheme is used in which each file name starts with the sub-array name, followed by
the UT date of the observation in the format yyyymmdd, followed by a five-digit observation number, followed
by the sub-scan number. The name ends with the standard suffix .sdf used by all Starlink NDF data files. For
instance, the files listed above hold data from the s8a sub-array for Observation 34 taken on 12th January
2016.
Raw POL-2 data come in uncalibrated units. The first calibration step is to scale the raw data to units of picowatts (pW) by applying the flat-field solution. This step is performed internally by the Smurf command calcqu—used to calculate , , and time-streams from the raw data—but can be done manually when examining the raw data.
If the purpose of a given POL-2 observation is to determine the percentage polarisations or vector angles within a source/region of interest, then the data may remain in pW. On the other hand, if the purpose is to establish the absolute polarised intensities, then a value for the Flux Conversion Factor (FCF) is required.
The resulting map may have the FCF applied to convert it into units of janskys. As is recommended with SCUBA-2 observing, it is advisable to check that the FCF value applied to the data is sensible (and must be done manually). For more details see Chapter 4.5.
1The total intensity of the source, , is .