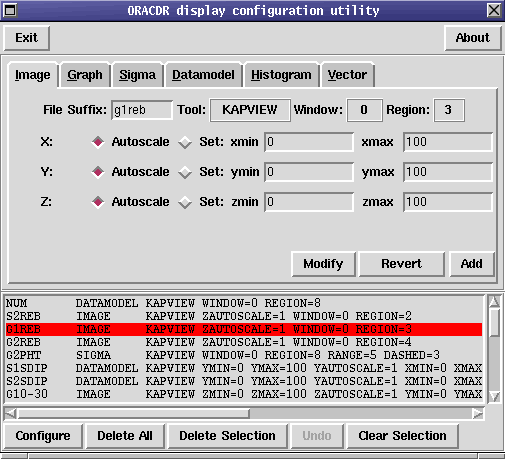
Orac-dr uses a fully configurable display system. By default the data display is turned on but can be turned off by using the -nodisplay option when starting Orac-dr. For a more general introduction to the display system see SUN/230.
The default configuration is to use Kappa graphics commands via the kapview monolith, and uses a single GWM/GKS window split into sections. For mapping observations the individual reduced frames are displayed in the top two quadrants and reduced groups displayed in the lower quadrants (only one quadrant is used per sub-instrument). For skydips and photometry observations the display is split into two horizontal regions.
The Orac-dr display interface currently can use Kappa and Gaia6. The Gaia interface can only support image display whereas the Kappa (kapview) interface can support imaging, graphs, scatter plots and vector plots.
Orac-dr can be configured to use the following display types:
The display is configured via the oracdisp tool and the disp.dat file found in ORAC_DATA_OUT. The
oracdisp tool provides a graphical front-end to the display system and can be used to control where
images are displayed, what type of display is used and how the data should be displayed.
oracdisp runs independently of the pipeline, the only interaction between the pipeline
and oracdisp is via a configuration file. Each time a primitive requests that a data file
should be displayed the pipeline compares the graphics ID generated by the frame itself
(usually the last suffix) with the list of suffixes stored in the display configuration file. If they
match, the configuration file is read (including information such as where to display it,
the type of device and the bounds) and the corresponding display engine is instructed to
display the data file using the supplied option. If multiple matches are made, then multiple
display requests are processed. In this way a single display request from a primitive can be
used to display multiple images (e.g. load an image into Gaia and display a slice using
Kappa).
The oracdisp tool is shown in figure 1. The tool is split into 3 major sections:
ORAC_DATA_OUT/disp.dat). No
backup is made of the original file.
The string that should be placed in the ‘File Suffix’ entry widget is discussed in the next section.
For SCUBA data, the products of early stages of data reduction (e.g. flatfielding or despiking) are not really suitable for display so many of the early primitives do not contain display directives.
Table 1 lists the suffices along with the primitives that generate the display request (and therefore must be called in the recipe).
| Suffix | Type of image | Primitives |
| noise | Noise | _REDUCE_NOISE_ |
| sdip | Skydip | _DISPLAY_SKYDIP_ |
| pht | Photometrt data | _DISPLAY_PHOTOM_GROUP_ |
| reb | Rebinned image | _REBIN_FRAME_ |
| pol | Polarisation (I,P,THETA) image | _CALCULATE_POLARISATION_FRAME_ |
| p | Polarisation P image | _CALCULATE_POLARISATION_FRAME_ |
| theta | Polarisation THETA image | _CALCULATE_POLARISATION_FRAME_ |
Each of these suffixes can be prefixed by an ‘sN’ prefix where ‘s’ stands for sub-instrument and N is a number indicating the position of the sub-instrument in the raw data (for SCUBA N is usefully between 1 and 3). For example, a display definition to display both the long and short rebinned images should contain definitions identified by ‘s1reb’ and ‘s2reb’ whereas ‘reb’ would be relevant if only 1 sub-instrument is being processed.
Table 2 lists the group suffixes recognised by the display system. In a similar way to frame definitions, all group id’s are prefixed by ‘gN’ where ‘g’ indicates that a group is being displayed and ‘N’ is the sub-instrument number. Unlike for frames, the gN prefix is always attached regardless of the number of sub-instruments in the group.
The _REBIN_EM2_GROUP_ primitive uses a gNpa-thr where ‘pa’ refers to the position angle of the
chopped data and ‘thr’ to the chop throw. For example, to view the rebinned image of the data taken
with 65 arcsec chop at 90 degrees position angle for the first sub-instrument a display id of ‘g190-65’
would be required.
| Suffix | Type of image | Primitives |
| gNreb | Rebinned image | _REBIN_GROUP_ & _REBIN_EM2_GROUP_ |
| gNpa-thr | Rebinned dual-beam image | _REBIN_EM2_GROUP_ |
| gNpht | Photometry results | _DISPLAY_PHOTOM_GROUP_ |