
The AAT Wave-plate spectropolarimeter is normally used with CCD detectors. The normal mode of operation is to use a two hole decker above the slit defining star and sky apertures, together with a calcite beam splitter. This gives images containing four spectra, star and sky for each of the O and E modes of the calcite. Images of this type are recorded for four positions of the half-wave plate at angles 0.0, 45.0, 22.5, 67.5 degrees.
Calibration observations can be made by inserting calibration polarizers into the beam. Rotation of the instrument to different position angles is not necessary.
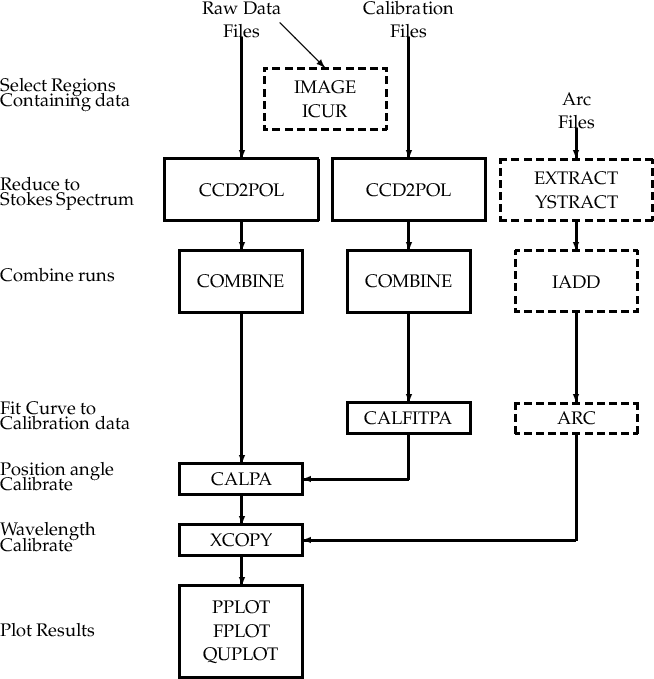
To reduce such a data set requires a combination of Figaro and TSP commands. Figaro is used for the standard spectroscopy parts of the reduction such as arc fitting, and reducing flux standards. TSP is used for the polarimetric parts of the reduction. The basic sequence of reductions is shown in figure 2.
The first step in the reduction is to identify the regions of the image containing the four spectra. Having done this the command CCD2POL can be used to reduce the raw images for the four plate positions to TSP format polarization spectra. Different observations can then be combined using the COMBINE command.
The polarization data can be plotted using the PPLOT command to check the progress of the reduction, and the consistency of different observations, before combining them.
The efficiency of the wave-plate polarimeter system is very close to 100%, and thus efficiency correction is hardly necessary. If required it can be done with the CALFIT and CALIB commands as described for the Pockels cell polarimeter.
An additional complication with the wave-plate polarimeter is that the apparent position angle varies with wavelength as a consequence of the wavelength dependence of the position of the fast axis of the superachromatic plate. This effect can be calibrated by using observations with known position angle, either of a star through the calibration polarizer, or of a polarized standard star. The CALFITPA command can be used to fit a Chebyshev polynomial to the wavelength dependence of the position angle, and this calibration curve can then be applied to observations using the CALPA command.
Calibration lamp observations can be fitted using the Figaro ARC program, as described in the Figaro manual. The resulting wavelength calibration can then be copied to a TSP file using the TSP command XCOPY, which is similar to the Figaro command of the same name. If desired the TSP data can then be scrunched (rebinned to a linear wavelength scale) using the TSP SCRUNCH command.
Observations of standard stars can be used to derive a flux calibration curve using the methods described in the Figaro documentation. This calibration curve can then be applied to a TSP polarization spectrum to give a flux calibrated polarization spectrum. Note that TSP does not keep track of the total exposure time as spectra are combined, so the total value must be supplied as a parameter to SPFLUX.
There are a number of commands to plot polarization spectra. SPLOT plots a single Stokes parameter, as percentage polarization, together with the intensity spectrum. PPLOT plots percentage polarization, position angle, and intensity. Both these programs use a variable binning technique, to give a constant polarization error per bin.
FPLOT plots data in the form of polarized intensity (or flux). QUPLOT plots a QU diagram.