Figure 3: Procedure for Reduction of CGS4 Spectropolarimetry
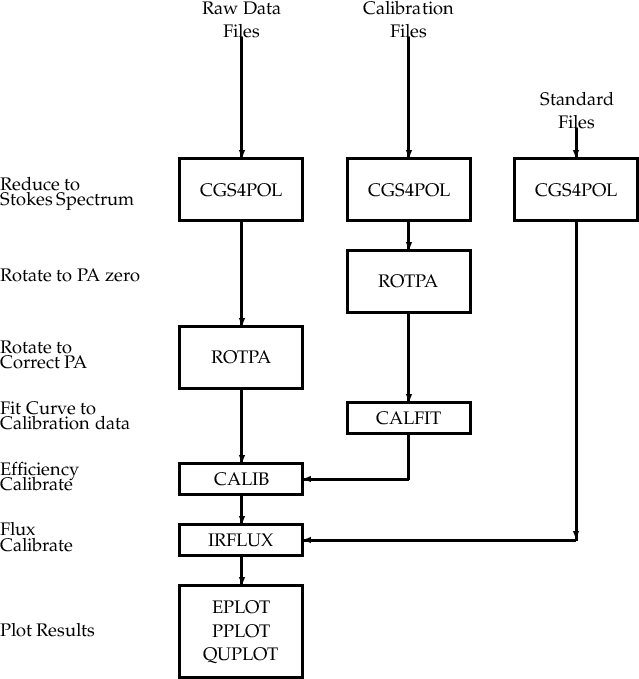
The UKIRT cooled grating spectrometers CGS4 and CGS2 can be used for spectropolarimetry in conjnuction with the IRPOL polarimetry module which is used to rotate a half-wave plate in front of the instrument. In conjunction with a wire grid polarizer in the dewar this results in data from which linear polarization can be derived. A typical procedure for reduction of such data is illustrated in figure 3. Note that the order of the various calibration steps is generally not critical (e.g. flux calibration may be done before PA and efficiency calibration).
The same procedure should be applicable to CVF spectropolarimetry data obtained with the UKT6 and UKT9 instruments.
The program CGS4POL takes four CGS4 reduced group files containing observations at waveplate angles of 0, 45, 22.5 and 67.5 degrees and extracts the spectra to obtain a polarization spectrum. The data files should contain positive and negative spectra, obtained by sliding between two slit positions for the star. Parameters of CGS4POL are the positions of the two apretures to extract the star data from, and the name (A or B) of the aperture containing the star.
The RCGS2 command reads raw CGS2 data files and produces TSP polarization spectra. RCGS2 can also perform despiking of data by specifying a cutoff level. Any points which deviate from the mean by more than this cutoff times the sigma for the wavelength are removed.
At this stage the data can be plotted using the EPLOT command to judge the quality of the data.
The only correction needed is a correction for position angle zero point. This can be determined by looking at an observation of a standard with known position angle, and then applied to the data using the ROTPA command, which rotates the position angle of a dataset through a specified angle. The PTHETA command may be useful in accurately determining the position angle for a section of the spectrum of a standard.
The half-wave plates and wire grid polarizers used will not give 100% efficiency, and the efficiency will normally be wavelength dependent. To calibrate for this effect an observation of a 100% polarized source should be made using the calibration wire grid polarizer. This observation can be reduced using CGS4POL or RCGS2. It should then be rotated using ROTPA so that the position angle is zero which puts all the polarization into the Q Stokes parameter. CALFIT can then be used to fit a calibration curve to this data. The CALIB command is then used to apply this calibration curve to other datasets.
The IRFLUX command can be used to flux calibrate data, using an observation of a standard star. IRFLUX models the standard star as a black body of a given temperature. The flux of the standard may be specified as a magnitude in one of the standard bands (JHKLM) or as a flux in mJy at a specified wavelength. The flux calibrated data is in mJy. It may be converted to Fλ using the FLCONV command if desired.
IR spectropolarimetry may be plotted using any of the commands described for optical spectropolarimetry (PPLOT, FPLOT, QUPLOT). However with the smaller number of spectral points the EPLOT command, which plots flux, P and Theta with error bars, will often be found more appropriate than the constant error binning approach used by PPLOT. Data may be plotted at any stage in the reduction after RCGS2 or CGS4POL.