This plot window is experimental and lacks some useful features. The details of the user interface may be changed in future versions.
The Time Plot ( )
is intended for plotting time series data.
You can find it in the Graphics
menu of the main Control Window, but since it is currently
experimental it does not appear in the main toolbar.
)
is intended for plotting time series data.
You can find it in the Graphics
menu of the main Control Window, but since it is currently
experimental it does not appear in the main toolbar.
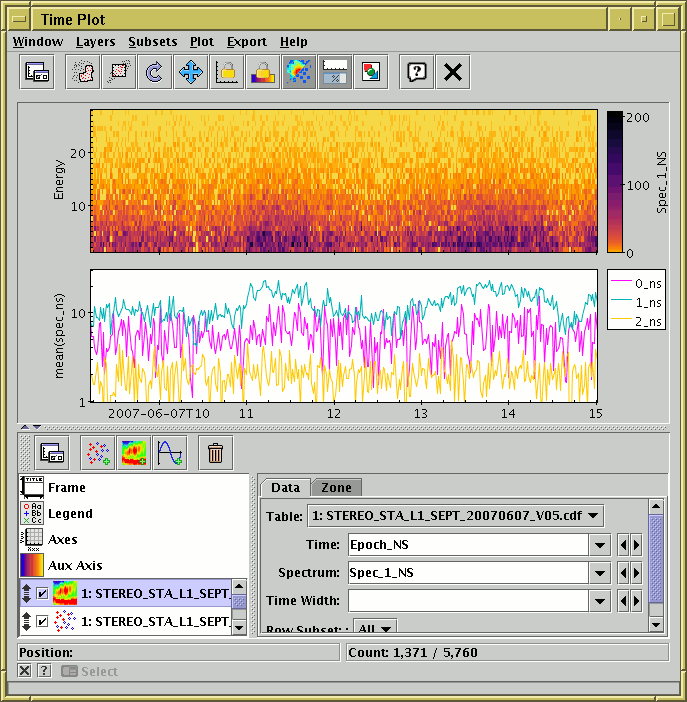
The horizontal axis represents time, and can be labelled accordingly, and the window can display functions of time, scatter plots and spectrograms.
Unlike the other plot windows (at time of writing) the Time plot can display different data plots in different plot Zones stacked vertically on top of each other, so that different plots share a time axis but have their own Y axis.
The Time Plot offers the following plot controls:
 Position Layer Control, with these form options:
 Line
Line
 Mark
Mark
 Error Bars (vertical bars only)
 Text Label
 Fill
Fill
 Quantile
 Grid
Grid
 Histogram Layer Control with these form options:
 Spectrogram Layer Control
 Function Layer Control
See the Window Overview for features common to all plotting windows. The following subsections describe zones, navigation and axis configuration.


