Appendix E
FCFs by Reduction Date
Ongoing development of the SCUBA-2 analysis has resulted in ongoing changes to the atmospheric opacity
relationships and the FCFs. Depending on when your data were reduced you will need to apply different
calibration values. orac-dr will automatically apply the appropriate values.
Note: As of the 2021A Starlink release, the opacity relationships and FCF values have been updated following
the results presented by Mairs et al. 2021 [16]. Historical values derived by Dempsey et al. 2013 [8] are presented
below the updated values for comparison.
Explanation of parameters (see also Appendix B):
Starlink currently applies the following multiplicative extinction correction to SCUBA-2 data:
|
| (E.1) |
where is the atmospheric opacity
at the given frequency, . “Opacity
relationships” relate the measured
to the atmospheric opacity at the operating frequencies of SCUBA-2,
(450 m)
and
(850 m).
Their form is:
|
| (E.2) |
where ,
, and
are
empirically derived coefficients (see Mairs et al. 2021 [16]). You can find out what opacity relationship was
applied by using the Kappa command hislist.
% hislist file | grep EXT.TAURELATION
This will return something like the following,
EXT.TAURELATION.450=(23.3,-0.018,0.05),
EXT.TAURELATION.850=(3.71,-0.040,0.202), EXT.TAUSRC=auto, FAKESCALE=1,
indicating, for example, that at 850 m,
=3.71,
=-0.040, and
=0.202.
There are two commonly used FCF types:
- Peak FCF (Jy/pW/beam)—multiply your map by this when you wish to measure absolute peak
fluxes of discrete sources.
- Arcsec FCF (Jy/pW/arcsec)—multiply
your map by this if you wish to use the calibrated map to do aperture photometry/extended
source flux recovery.
Note: The FCFs are applied after the extinction correction, so the values are intrinsically related to one
another. The proper extinction correction must be applied before using the FCF values presented
below.
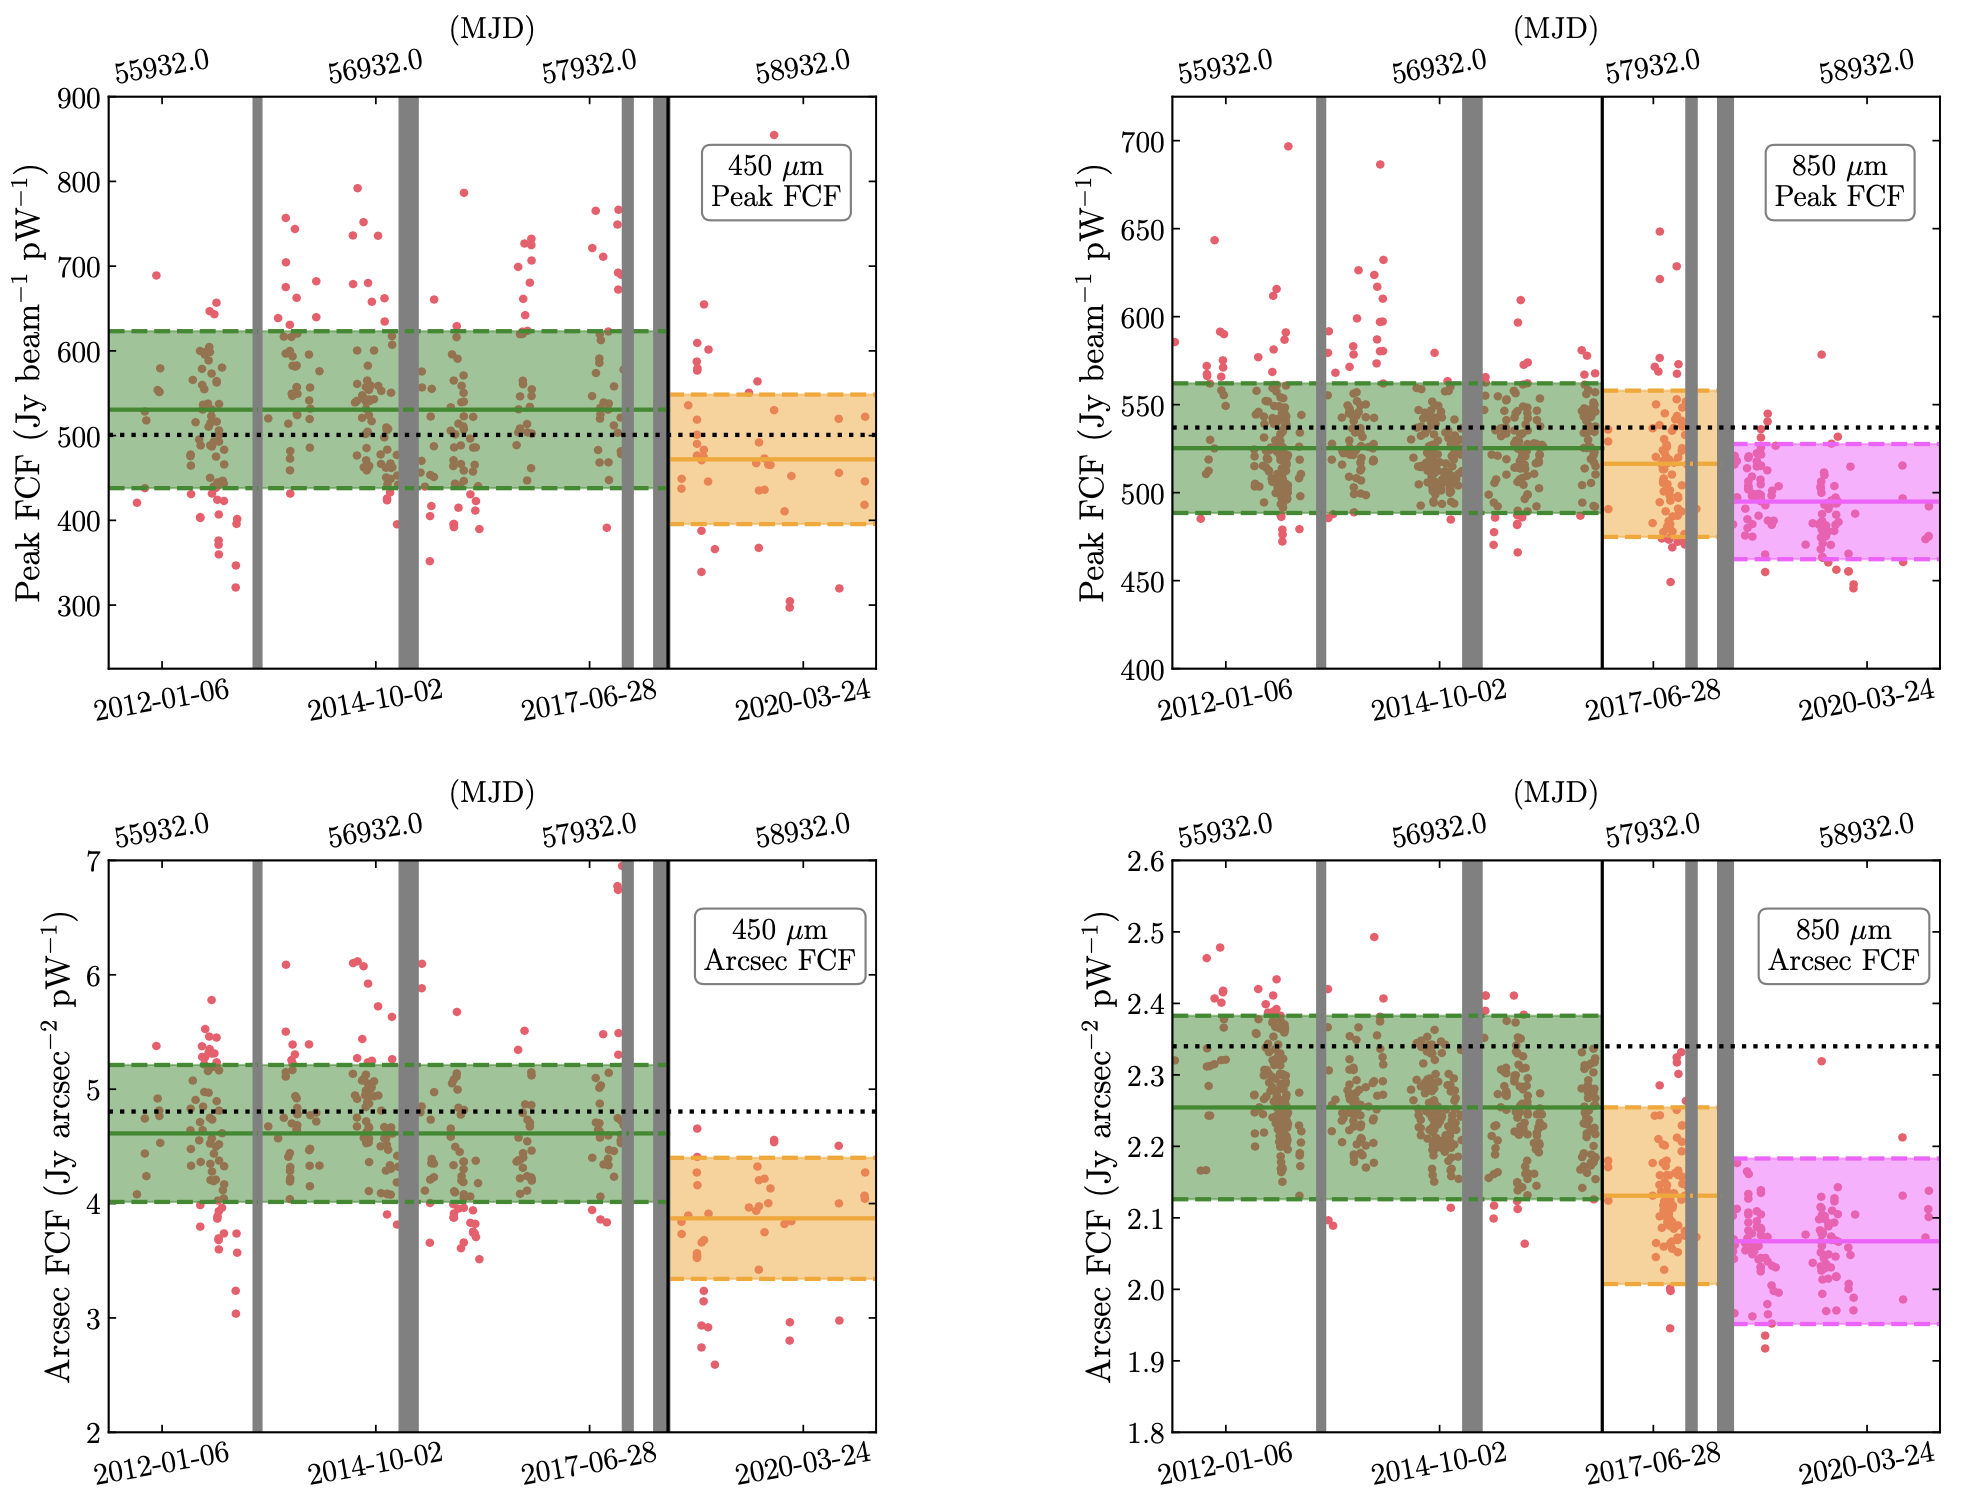
Results from Mairs et al. 2021 [16]. These are employed by default from Starlink Version 2021A. Dates are
inclusive. See Figure E.1.
|
|
|
|
|
| Date | FCF – 450 m | FCF – 850 m
|
|
|
|
|
|
|
|
| | Jy/pW/beam | Jy/pW/arcsec | Jy/pW/beam | Jy/pW/arcsec |
|
|
|
|
|
| until 2011 April 30 | 383 | 4.9 | 1080 | 5.0 |
| 2011 May 1–2016 November 1 | | | | |
| 2016 November 2–2018 June 29 | | | | |
| 2018 June 30 onwards | | | | |
|
|
|
|
|
| |
From 2011 May 1 onwards, the ,
, and
coefficients presented in the table below correspond to those in Equation E.2.
|
|
|
| Date | Opacity Relationship
|
|
|
|
|
| | 450 m | 850 m |
|
|
|
| until 2011 April 30 | 32 ( - 0.02) | 5.2 ( - 0.013) |
| 2011 May 1 onwards | | | | = 23.31.5 |
| = -0.0180.006 | | = 0.050.04 |
| | | | = 3.710.18 |
| = -0.0400.008 | | = 0.2020.044 |
|
|
|
|
| |
Results from Dempsey et al. 2013 [8]: employed by default in Starlink Version 2018A and previous
releases.
|
|
|
|
|
| Date | FCF – 450 m | FCF – 850 m
|
|
|
|
|
|
|
|
| | Jy/pW/beam | Jy/pW/arcsec | Jy/pW/beam | Jy/pW/arcsec |
|
|
|
|
|
| until 2012 January | 383 | 4.9 | 1080 | 5.0 |
| 2012 January–2012 July | 606 | 6.06 | 556 | 2.42 |
| 2012 July onwards | 491 | 4.71 | 537 | 2.34 |
|
|
|
|
|
| |
|
|
|
| Date | Opacity Relationship
|
|
|
|
|
| | 450 m | 850 m
|
|
|
|
| until 2012 January | 32 ( - 0.02) | 5.2 ( - 0.013) |
| 2012 January–2012 July | 26 ( - 0.01923) | 4.6 ( - 0.00435) |
| 2012 July onwards | 26 ( - 0.01196) | 4.6 ( - 0.00435) |
|
|
|
| |
Copyright © 2014-2021 Science and Technology Facilities Council,
East Asian Observatory