specx2ndf in the CONVERT package (see
SUN/55[6]) performs this task. Proceed as follows. First type:
to make the CONVERT applications available. Then type:
Note that though the input SPECX map and output NDF are respectively held in files called
l1689b.sdf and l1689bndf.sdf they are specified to application specx2ndf without the ‘.sdf’
file type.
When displaying SPECX maps it is conventional to represent the spectral axis as a series of
radial velocities computed for the rest wavelength of the line being observed and corrected to a
kinematical local standard of rest. By default specx2ndf generates the spectral axis in this
fashion and this is how it will be computed in the above example. However, specx2ndf allows
some flexibility in how the spectral axis is represented; see the appropriate section of SUN/55
for details of the alternatives available.
to make the KAPPA applications available. Then type:
Again the file name is specified without the ‘.sdf’ file type. This application lists the history
information describing the processing which has been performed on the data. The history
information appended by specx2ndf includes details of the way in which the spectral axis was
computed. It is also possible to inspect the structure of the data set using hdstrace. Simply
type:
As usual the file name is specified without the ‘.sdf’ file type. This facility is useful because it
lists the value of much of the auxiliary information contained in the data set. hdstrace is
documented in SUN/102[10]. In addition hdstrace will also work on the original SPECX
map.
ndf2dx, which is part of SX, the Starlink enhancements to DX (see
SUN/203[11]). By convention files in the native DX format have file type ‘.dx’. To convert the
entire data cube simply type:
Note that though the file type is not specified for the input NDF file, it should be given for the output native DX format file.
The above example will convert the entire data cube. However, often the useful information will be contained in only a small range of radial velocities. For example, in the example map most of the useful information lies between velocity channels 65 and 85. It is possible to convert a subset of the NDF corresponding to a given range of velocity channels. For example, to convert a subset corresponding to channels 65 through to 85 type:
The syntax to specify a subset of an NDF is to give the bounds of the required region inside
parentheses after the file name. Unfortunately however, by default the Unix shell will attempt to
interpret these parentheses. Thus, in the above example the input file name and NDF subset are
enclosed in single quotes in order to prevent this behaviour and ensure they are
passed correctly to ndf2dx. The use of ‘escape mechanisms’ of this sort to prevent the
premature interpretation of special characters sent to Starlink applications is discussed in
SC/4[3].
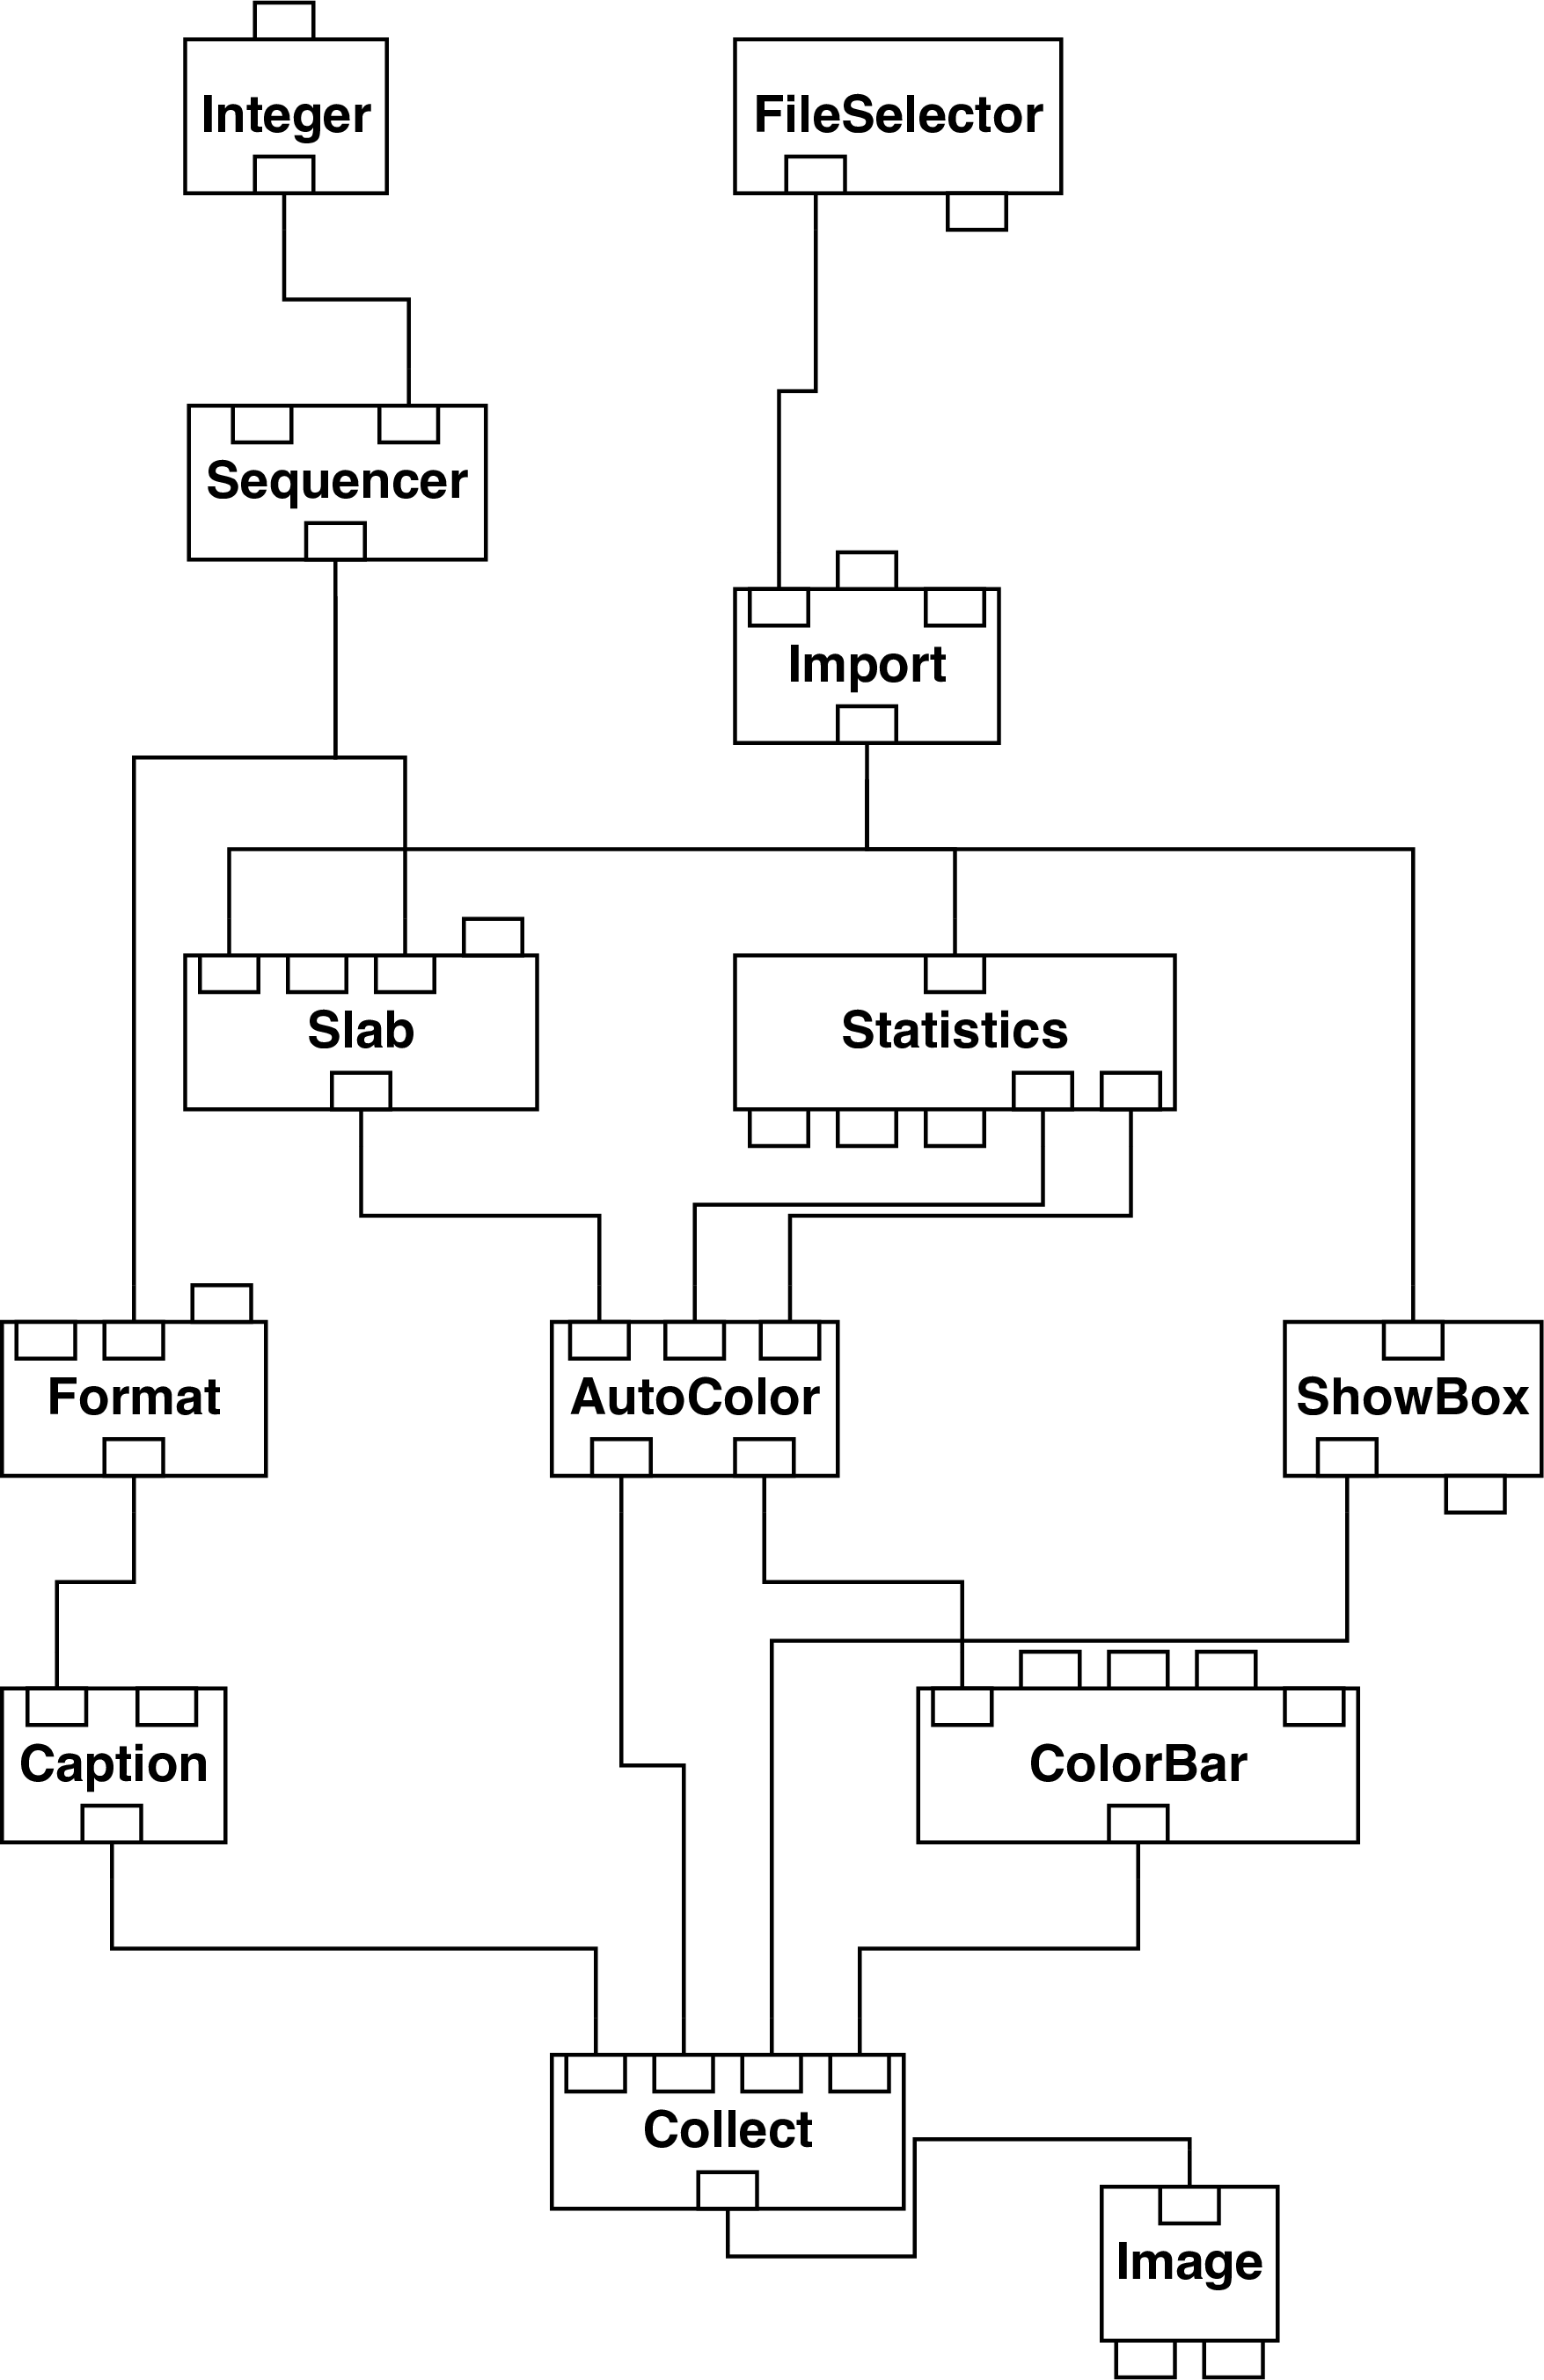
jcmtslice.net and jcmtslice.cfg (jcmtslice.net is the basic network and
jcmtslice.cfg is a ‘configuration file’ which controls some aspects of its behaviour). Start DX
(as described in Section 2). Then proceed as follows.
- (a)
- Load the network. Select the ‘Open Program’ option from the ‘File’ menu of the main
DX window. Select file
jcmtslice.net. The network should now load and appear in the main window. See Section 4 for further details. - (b)
- Select the ‘Open All Control Panels’ option from the ‘Windows’ menu of the main
DX window. Set the required file name and number of slices. (In the current example
these are
l1689bsub.dxand 20 respectively.) Close the ‘Control Panel’ window. - (c)
- Execute the network once. Once the network has executed you will probably have to reset the display window (option ‘Reset’ in the ‘Options’ menu of the display window). For a more effective display select ‘View control’ from the ‘Options’ menu and set the ‘Set View’ parameter to one of the ‘Off’ options, perhaps ‘Off top’.
- (d)
- Finally double click on the ‘Sequencer’ module and click on the play button. A sequence of slices sweeping through the data cube will now be displayed.
The network includes a ‘scale bar’ showing how the colour displayed for each pixel in each slice corresponds to the value of the pixel. In this example the value of each pixel is the radio ‘brightness temperature’ in kelvin.
jcmtsurface.net and jcmtsurface.cfg
(again jcmtsurface.net is the basic network and jcmtsurface.cfg is a configuration
file).
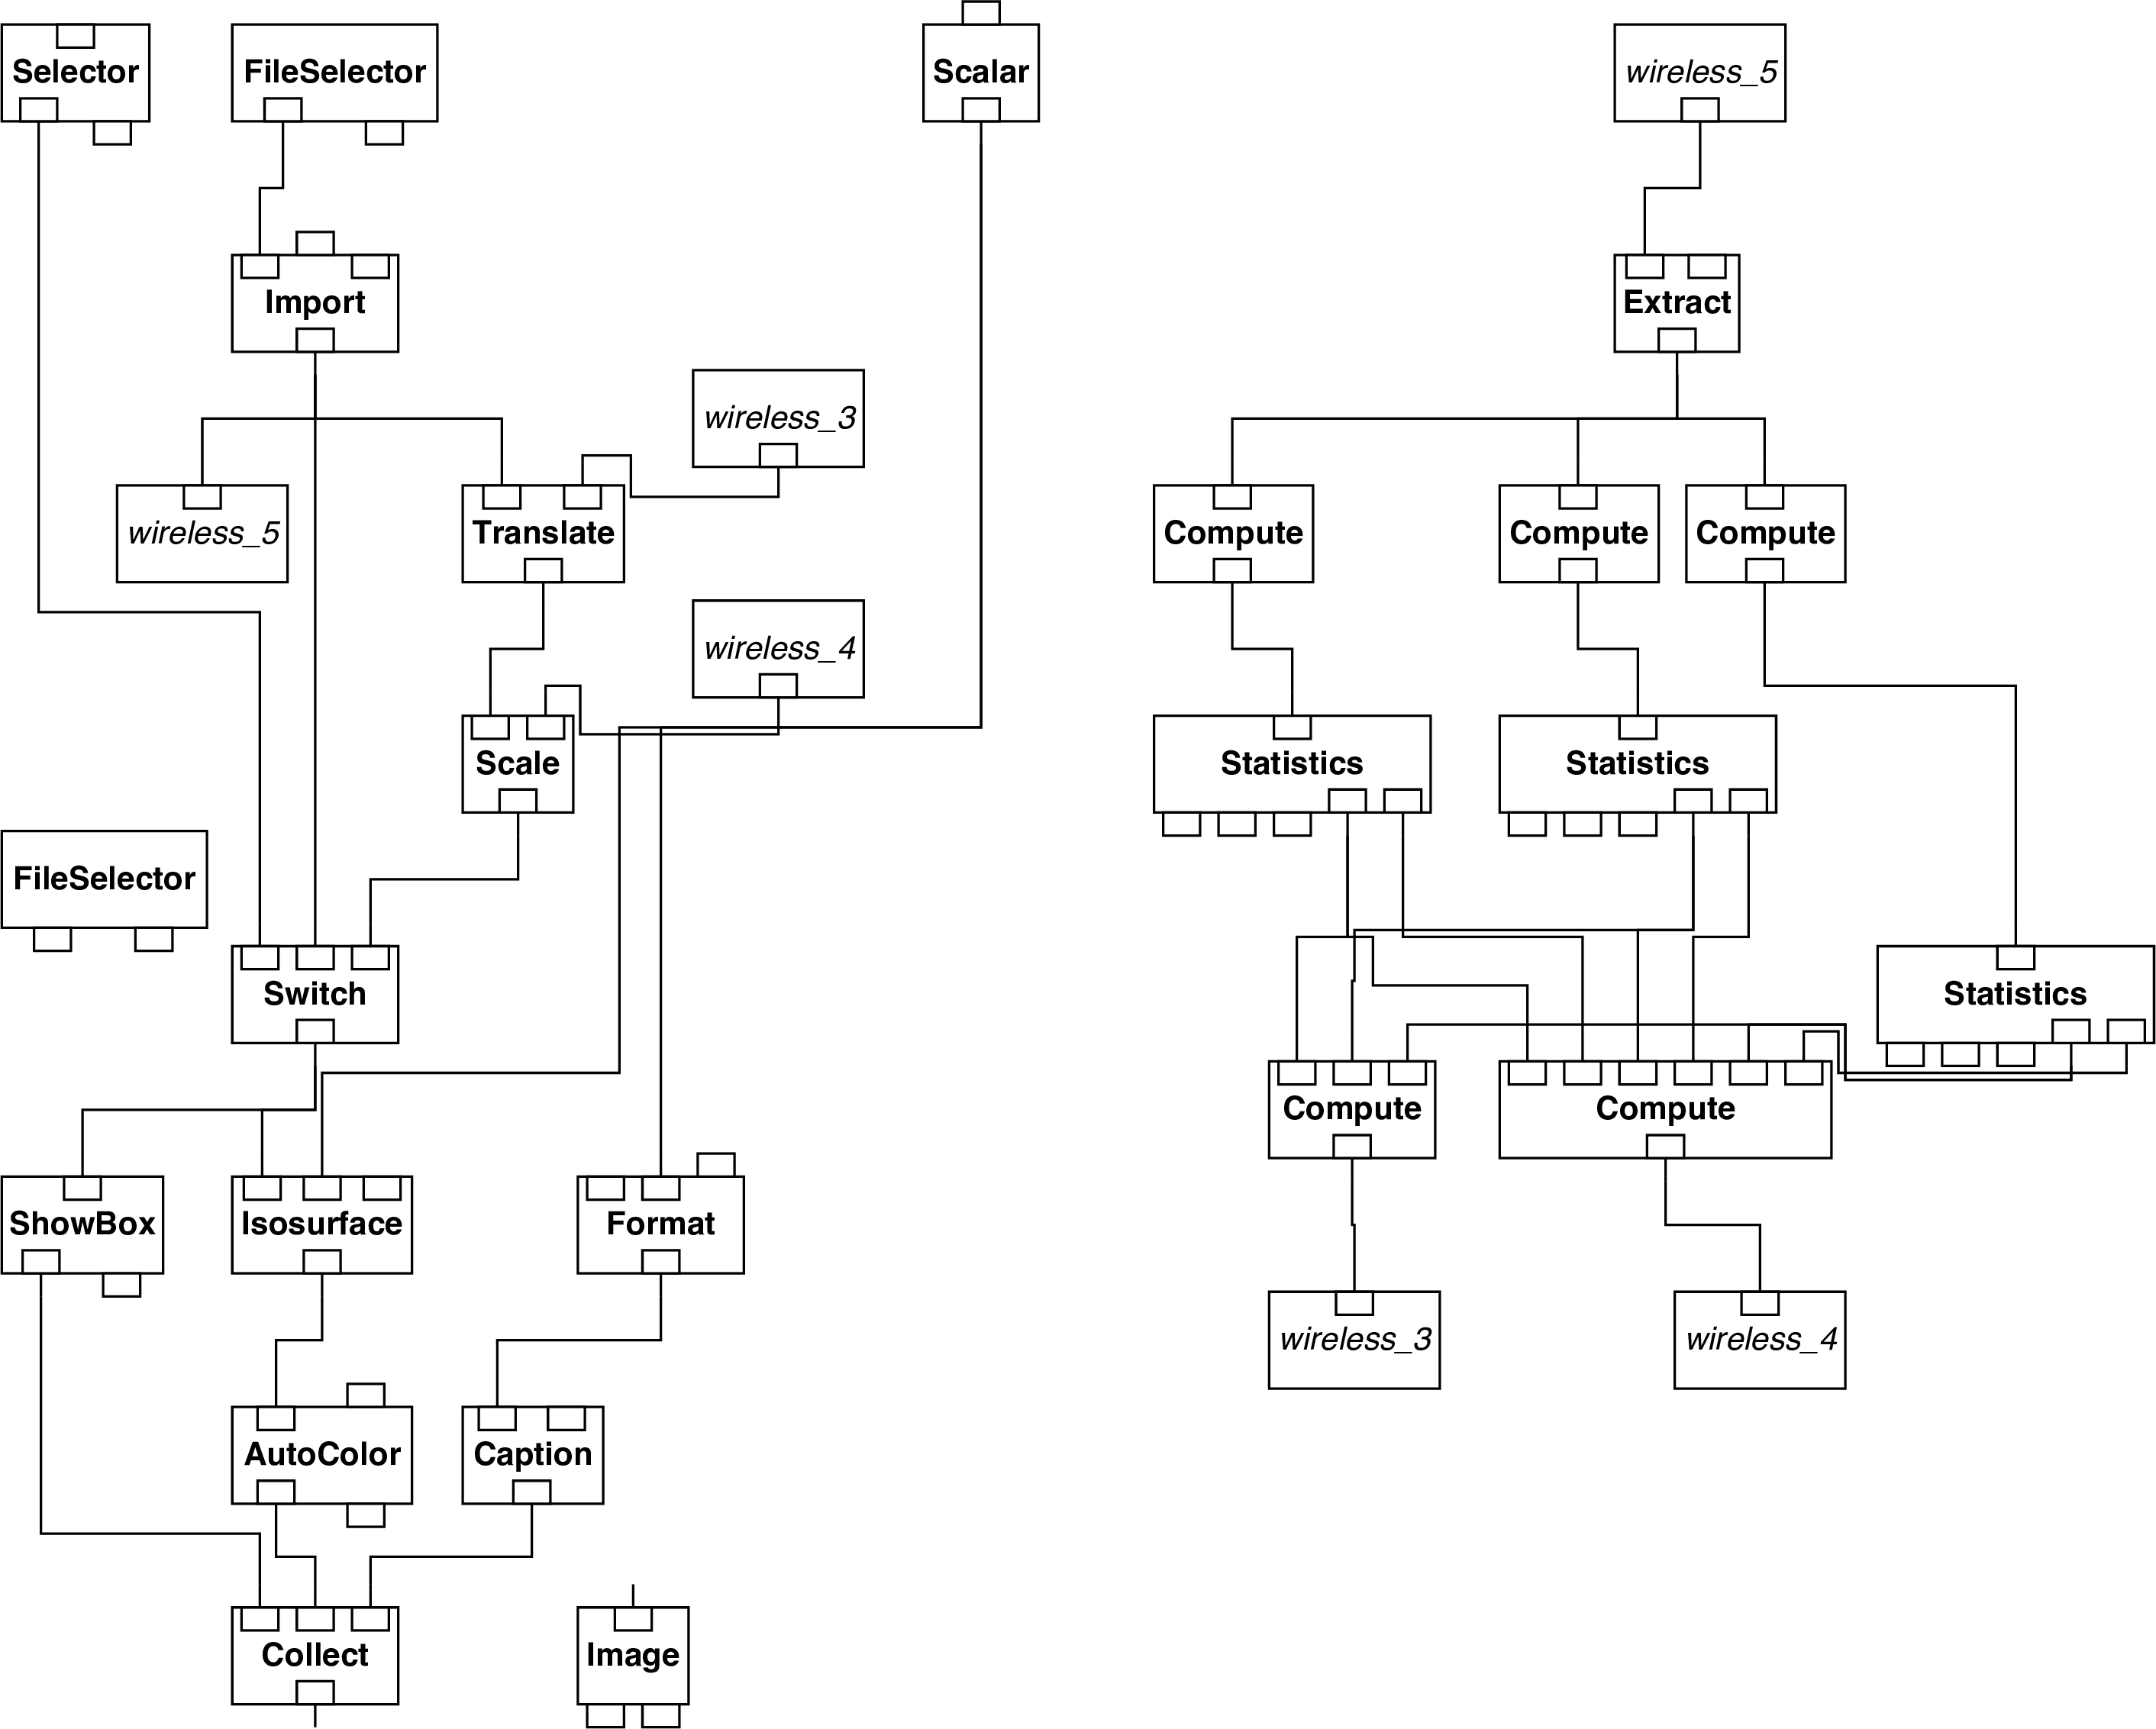
Much of the complexity of this network occurs because it contains an option to normalise the axes of the cube. Two of the axes correspond to positions on the sky and the third to the dispersion, usually expressed as a radial velocity computed from the rest wavelength of the line. There is no relation between the spacial and spectral axes, so the ‘cube’ can be either very ‘long’ or ‘thin’ in the spectral axis compared to the spacial ones. In order to generate an effective iso-surface it often helps to ‘normalise’ the cube so that it has unit length in each axis. Though this procedure often improves the iso-surfaces generated it makes the axes less intuitive. Hence it is made optional so that you can choose the alternative most suitable for your data.
- (a)
- Select the ‘Open All Control Panels’ option from the ‘Windows’ menu of the main
DX window. Set the axis units, file name and iso-surface value. In the current
example suitable values of these quantities are: normalised,
l1689bsub.dxand 3.5 respectively. The contour (or iso-surface) value is specified as a radio ‘brightness temperature’ in kelvin. Close the ‘Control Panel’ window. - (b)
- Execute the network once. Once the network has executed you will probably have to reset the display window (option ‘Reset’ in the ‘Options’ menu of the display window). For a more effective display select ‘View control’ from the ‘Options’ menu and set the ‘Set View’ parameter to one of the ‘Off’ options, perhaps ‘Off top’. Re-execute the network.
- (c)
- Use the various settings of the ‘Mode’ option in the ‘View Control’ window to pan, zoom and rotate the display in order to examine the iso-surface. These options are described in Section 2.3 Controlling the Appearance of an Object: the Image Window of the IBM QuickStart Guide[1].