ast2ndf in the CONVERT package (see
SUN/55[6]) performs this task. Proceed as follows. First type:
to make the CONVERT applications available. Then type:
Note that though the input Asterix binned dataset and output NDF are respectively held in files
called m82ast.sdf and m82ndf.sdf they are specified to application ast2ndf without the ‘.sdf’
file type.
It is also worth noting that an Asterix binned dataset is itself almost a standard Starlink NDF.
ast2ndf merely makes the data format completely standard and rearranges the order of the
axes.
hdstrace. Simply
type:
Again the file name is specified without the ‘.sdf’ file type. This facility is useful because it lists
the value of much of the auxiliary information contained in the data set. hdstrace is
documented in SUN/102[10]. In addition, hdstrace and many other standard Starlink
applications, will also work on the original Asterix binned dataset.
ndf2dx, which is part of SX, the Starlink enhancements to DX (see
SUN/203[11]). By convention files in the native DX format have file type ‘.dx’. To convert the
entire data cube simply type:
Note that though the file type is not specified for the input NDF file, it should be given for the output native DX format file.
The above example will convert the entire data cube. However, often the useful information will be contained in only a small range of energies. For example, in the example dataset most of the useful information lies between energy steps 5 and 15. It is possible to convert a subset of the NDF corresponding to a given range of energy steps. For example, to convert a subset corresponding to steps 5 through to 15 type:
The syntax to specify a subset of an NDF is to give the bounds of the required region inside
parentheses after the file name. Unfortunately however, by default the Unix shell will attempt to
interpret these parentheses. Thus, in the above example the input file name and NDF subset are
enclosed in single quotes in order to prevent this behaviour and ensure they are
passed correctly to ndf2dx. The use of ‘escape mechanisms’ of this sort to prevent the
premature interpretation of special characters sent to Starlink applications is discussed in
SC/4[3].
The axes=no option causes ndf2dx to ignore any axis information present in the input dataset
and write the output DX file with axes consisting of simple pixel numbers. This option may or
may not be appropriate depending on the details of your data. In the present case it leads to a
better visualisation.
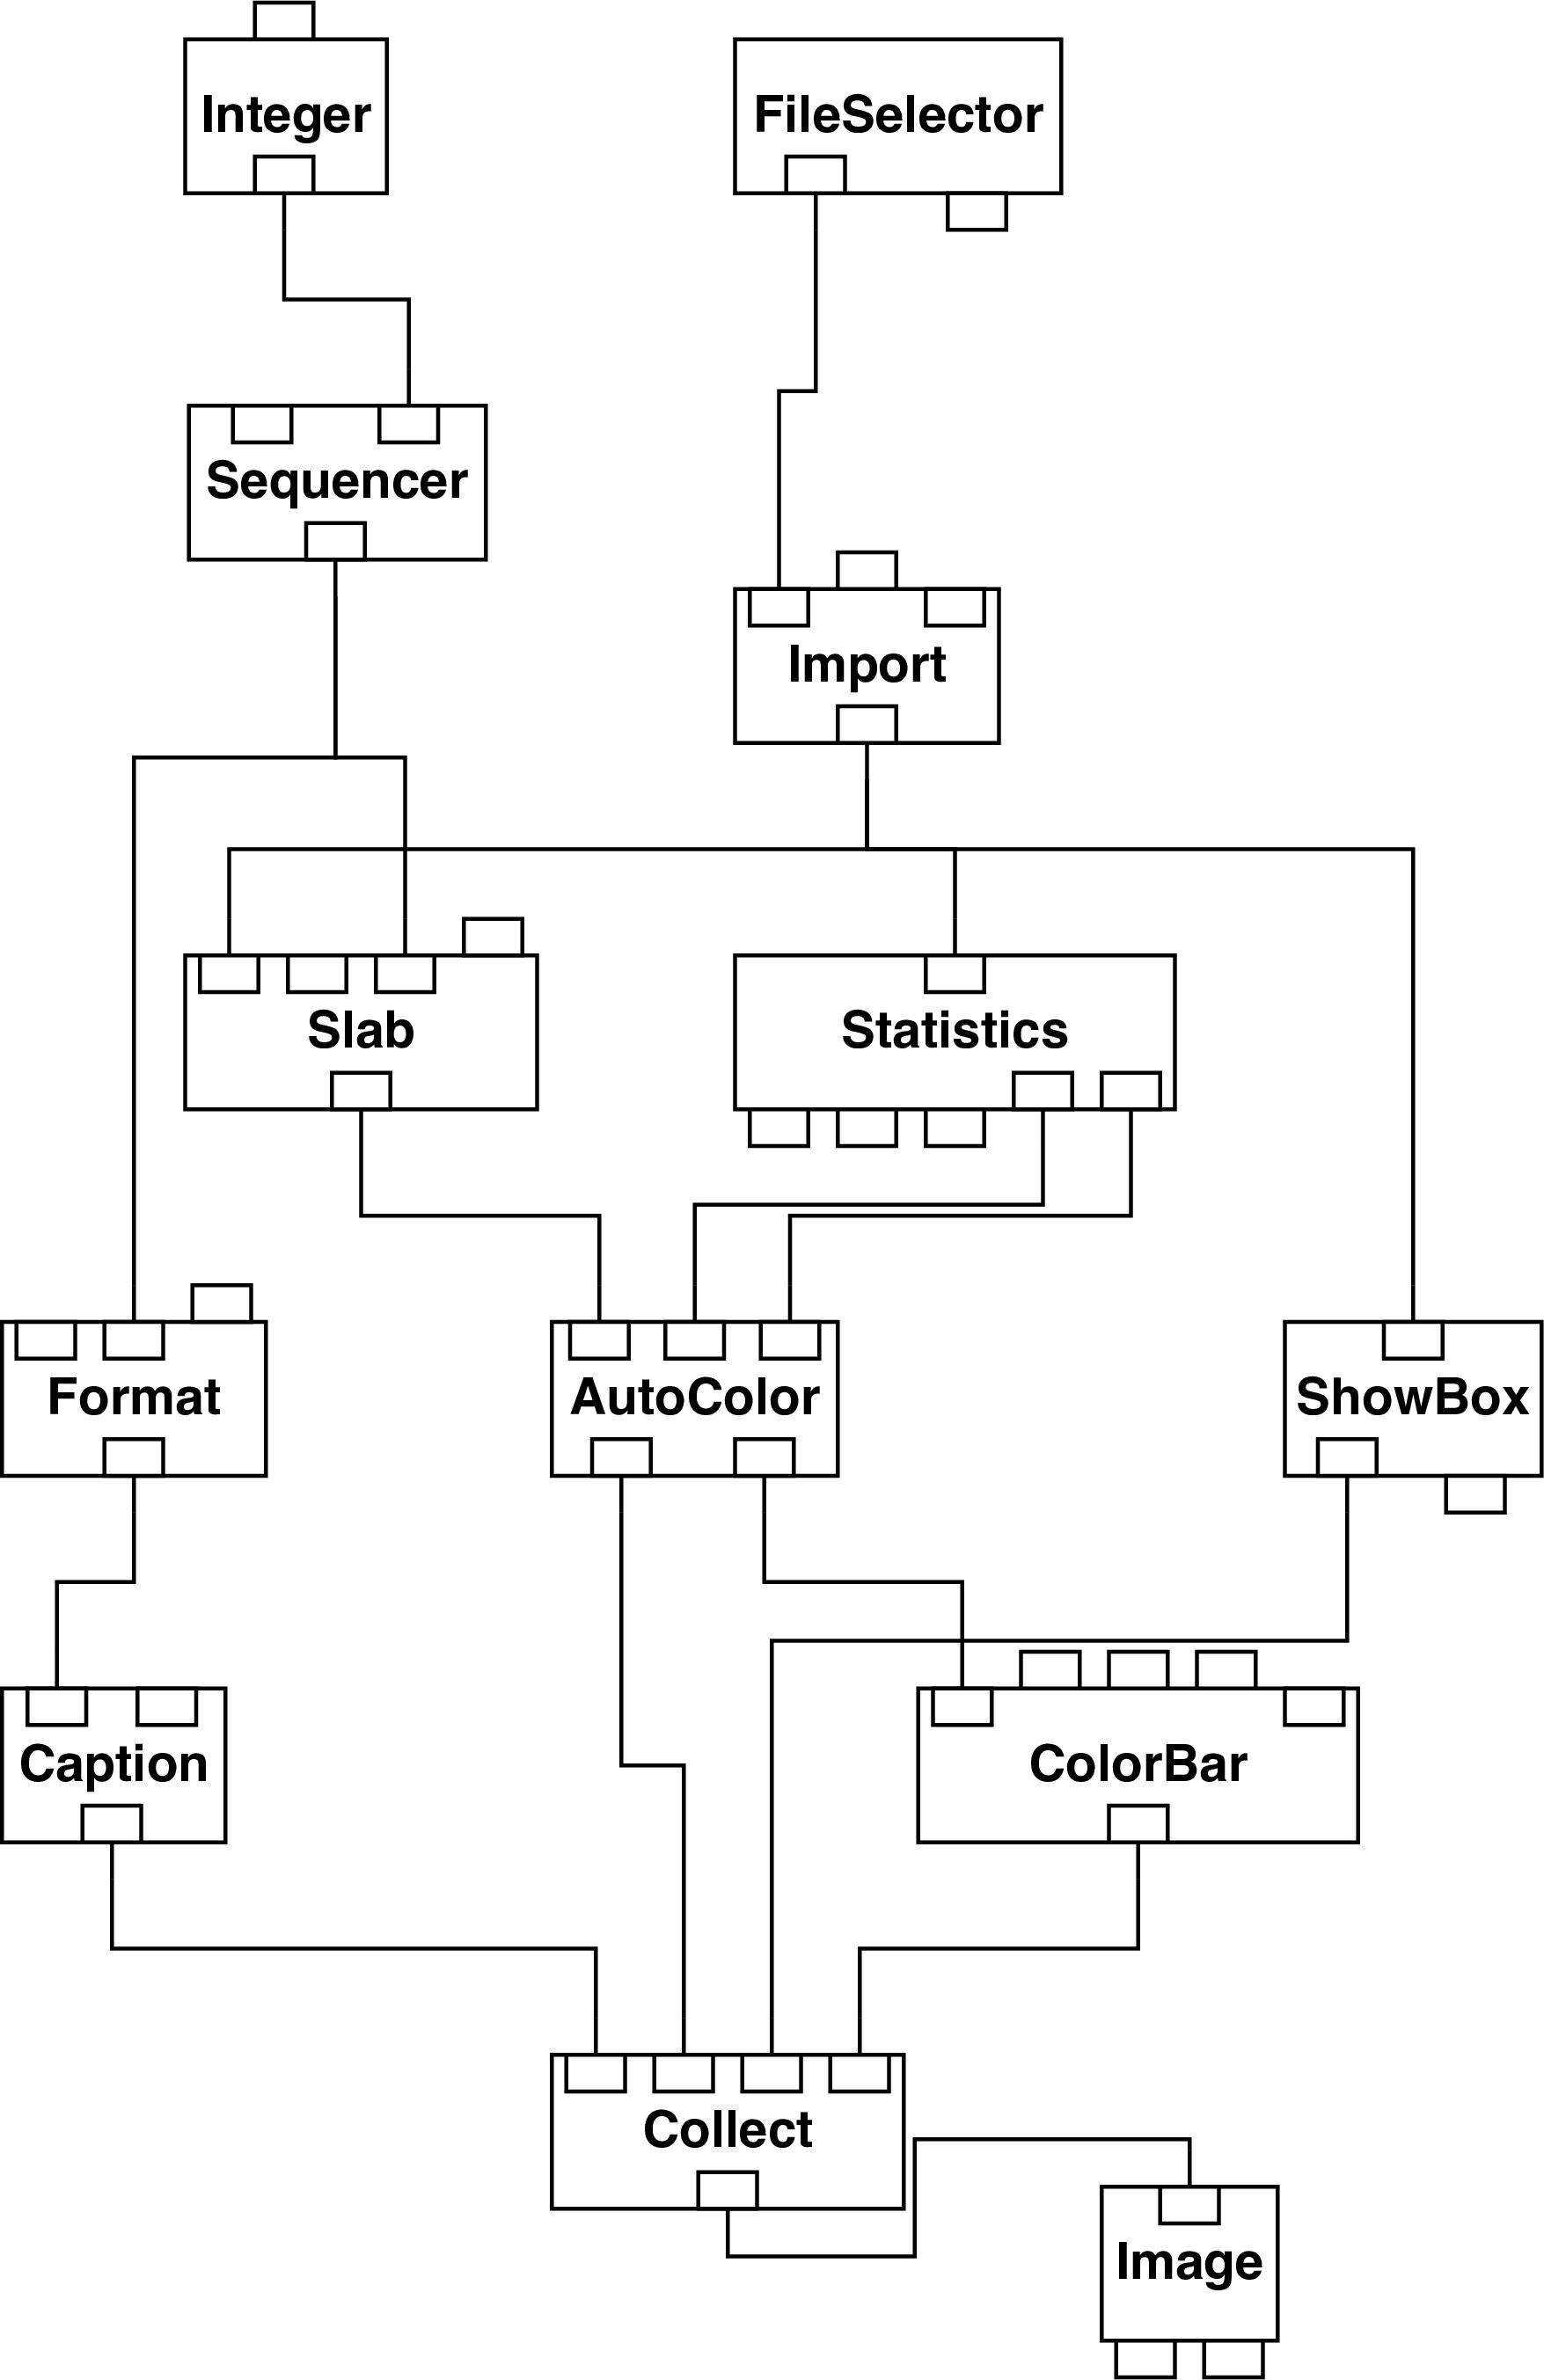
rosatslice.net and rosatslice.cfg (rosatslice.net is the basic network
and rosatslice.cfg is a ‘configuration file’ which controls some aspects of its behaviour). Start
DX (as described in Section 2). Then proceed as follows.
- (a)
- Load the network. Select the ‘Open Program’ option from the ‘File’ menu of the main
DX window. Select file
rosatslice.net. The network should now load and appear in the main window. See Section 4 for further details. - (b)
- Select the ‘Open All Control Panels’ option from the ‘Windows’ menu of the main
DX window. Set the required file name and number of slices. (In the current example
these are
m82sub.dxand 10 respectively.) Close the ‘Control Panel’ window. - (c)
- Execute the network once. Once the network has executed you will probably have to reset the display window (option ‘Reset’ in the ‘Options’ menu of the display window). For a more effective display select ‘View control’ from the ‘Options’ menu and set the ‘Set View’ parameter to one of the ‘Off’ options, perhaps ‘Off top’.
- (d)
- Finally double click on the ‘Sequencer’ module and click on the play button. A sequence of slices sweeping through the data cube will now be displayed.
The network includes a ‘scale bar’ showing how the colour displayed for each pixel in each slice corresponds to the value of the pixel. In this example the value of each pixel is the count rate in counts per second. This network for displaying ROSAT data is virtually identical to the corresponding network for JCMT data (see Section 13 and Figure 15). The only differences are the defaults for the file names and the axis labels. Similarly, the network for generating an iso-surface in JCMT data (see Figure 16) requires only minor cosmetic modifications to display ROSAT data.
