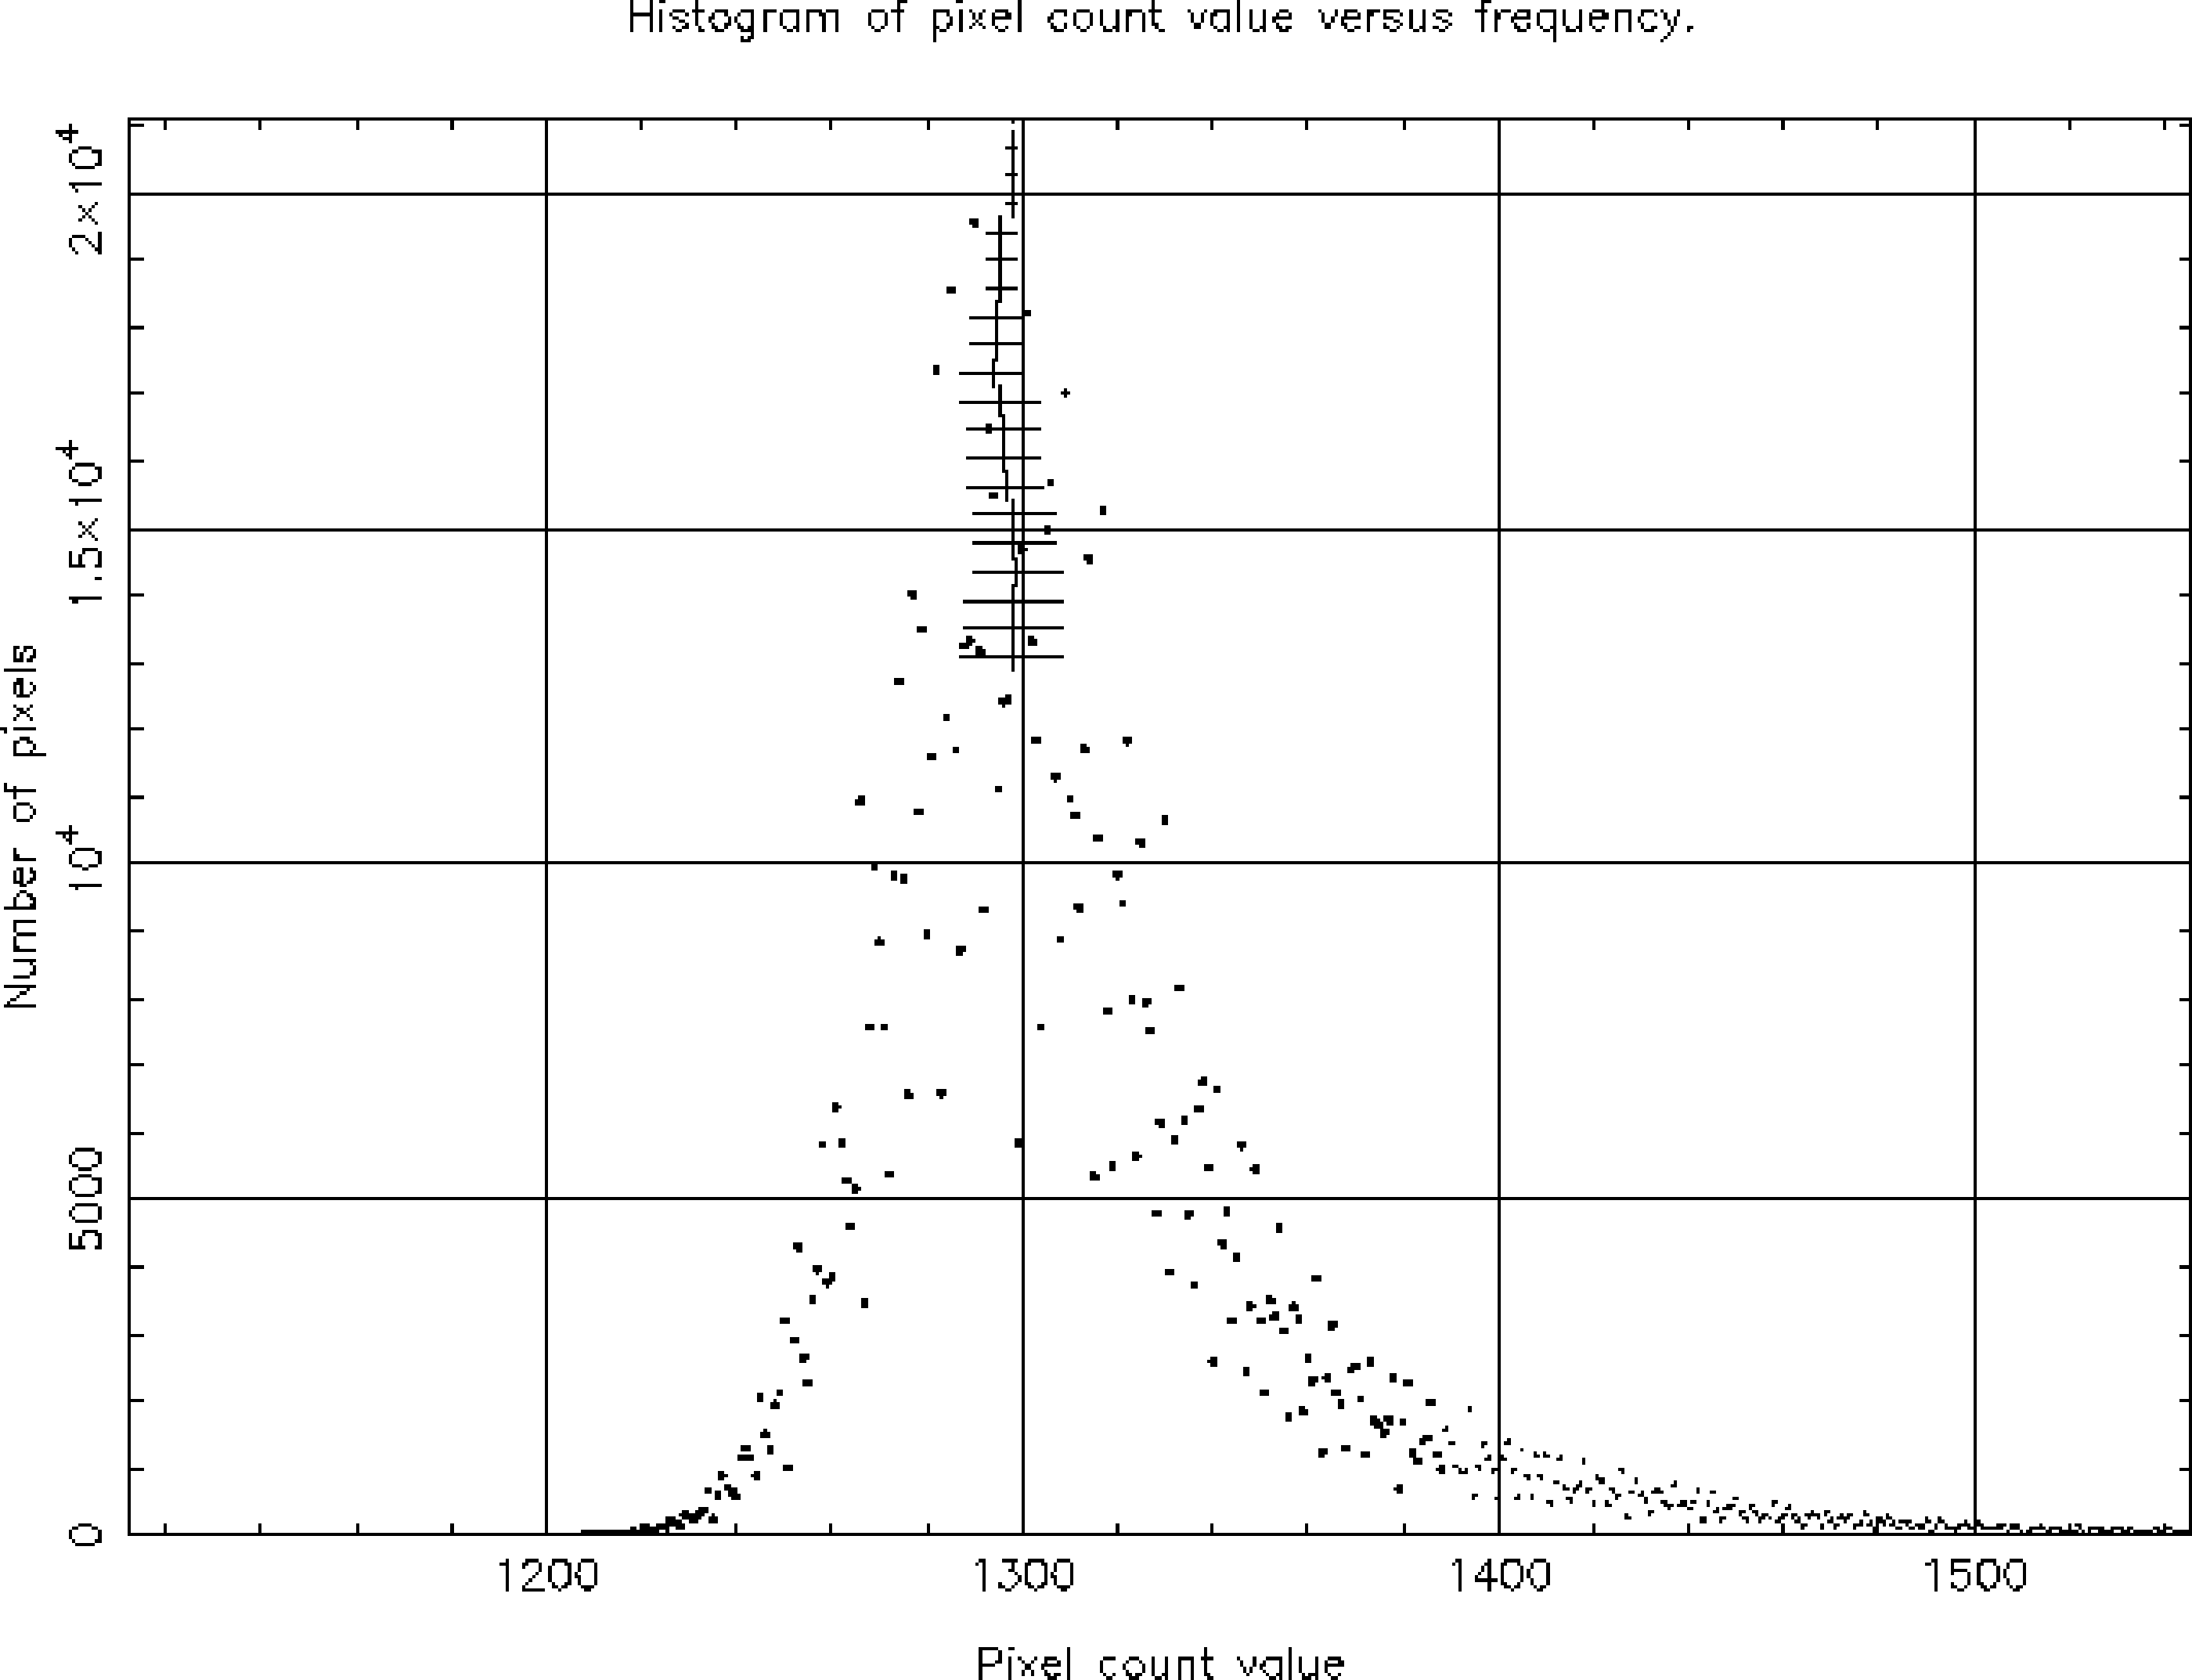
histpeakIn the same way that it was useful to display images at intermediate stages in the data reduction, it is often useful to be able to calculate and list gross statistics (mean value, standard deviation etc.) for images as they are processed. There are a couple of applications which provide this facility. Proceed as follows.
The following information should be displayed:
Text file ngc2336_r_2.log will be created containing a copy of the output.
stats has a ‘κ-sigma
clipping’ option which allows outlying values, such as star images, to be rejected
when computing the statistics. If a clipping level is given, stats will compute
statistics using all the available pixels, reject all those pixels whose values lie outside
κ
standard deviations of the mean and then re-evaluate the statistics. An array of up to five
clipping levels may be given, which are applied sequentially. For example, to reject values
outside two standard deviations type:
The statistics will again be displayed, but this time the clipping will have been applied before they were computed.
stats will be adequate. However, application
histpeak in the ESP package (see SUN/180[12]) gives further details. To load ESP
type:
then type histpeak and respond to the prompts:
Output similar to the following should be produced:
and a plot similar to Figure 11 should appear. For the purpose of determining the sky
background level it is probably best to use either histpeak or stats with the clipping option.
Also note that the histpeak pre-amble contains the dimensions and bounds of the
image.