
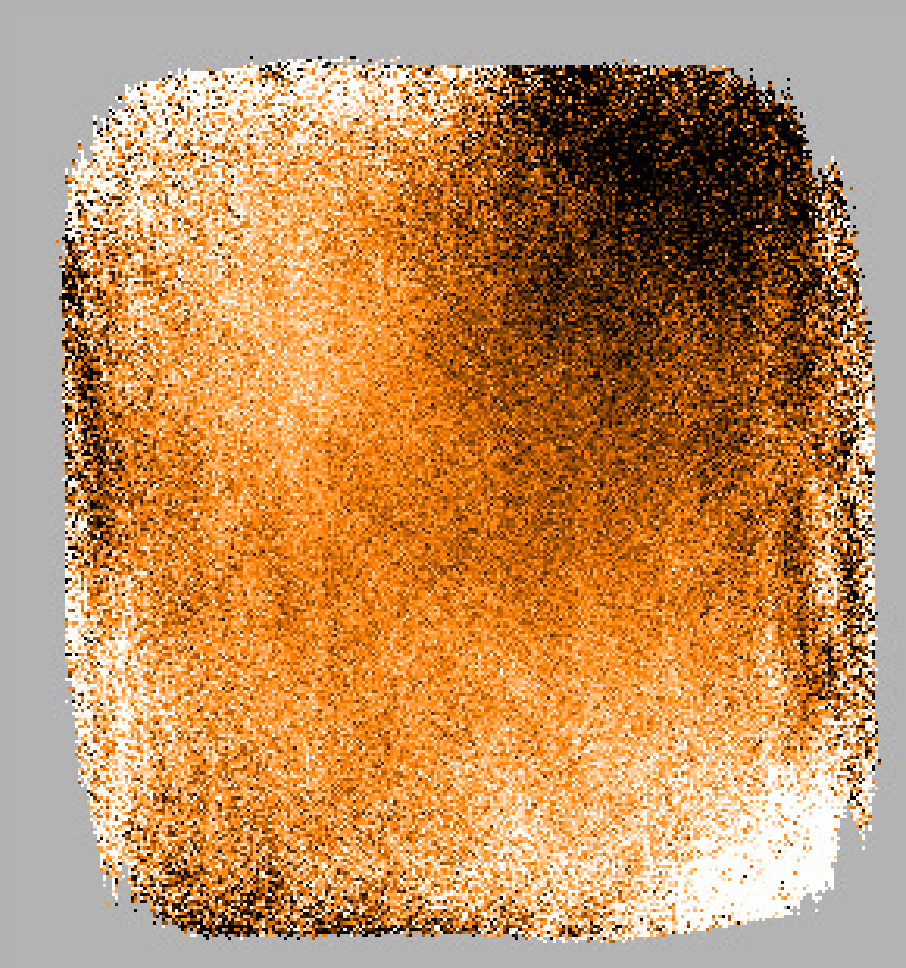
dimmconfig_blank_field.lis which gives a significantly
flatter result than Right: map using the default dimmconfig.lis.Many deep SCUBA-2 observations are designed to detect unresolved point sources. In this example we work through the reduction of a cosmology survey, in which targets are high-redshift star-forming galaxies (although the procedure is applicable to any observation of faint, unresolved objects). Since the surface density of these distant sources falls rapidly with increasing brightness, most objects are, on average, only slightly brighter than the extra-galactic confusion limit – the flux density below which the surface density of sources is so great that there are many blended objects within a telescope beam. Consequently, the sources of interest are usually only a few standard deviations brighter than the noise in the map (caused by a combination of instrumental and source confusion). In light of this, the recommended strategy for reducing such maps involves two basic steps:
dimmconfig_blank_field.lis (see Section 4.1) which, compared to
the default configuration, sacrifices structure on large scales to gain the best possible
noise performance on small scales (i.e. making the map as flat as possible). This is a good
compromise, since the sources should generally be the size of a telescope beam.
For this example we will reduce a 13 minute, 450 μm, 6×6 arcmin CURVY_PONG map towards the galaxy cluster MS0451 (see Section 1 for instructions on obtaining the data for this tutorial and the usage policy). Although not deep enough to detect any individual sources, this example is useful for illustrating features that are common to most of the extra-galactic SRO data from the Spring of 2010.
First, assuming the data are in the current directory, we produce a map using the specialized
dimmconfig_blank_field:
For comparison, we also make a map using the default configuration:
Both of the maps are shown in Fig. 11. Clearly the specialized configuration yields a flatter map, although the white noise level is still quite large (no obvious sources are visible), and there is some residual structure in the map caused by low-frequency noise that is not effectively modeled/removed by the map-maker (vertical stripes that are aligned with the map edges).


dimmconfig_blank_field.lis which gives a significantly
flatter result than Right: map using the default dimmconfig.lis.In order to optimally find sources that are the size of the telescope beam, and suppress this residual
large-scale noise, we provide a Picard recipe (see Section 5.2) called SCUBA2_MATCHED_FILTER.
If there were no large-scale noise in the map, the filtered signal map would be calculated as follows:
|
ℳ=[M(x,y)/σ2(x,y)]⊗P(x,y)[1/σ2(x,y)]⊗[P2(x,y)], | (9) |
where M(x,y) and σ(x,y) are the signal and RMS noise maps produced by Smurf, and P(x,y) is a map of the PSF. Here ‘⊗’ denotes the 2-dimensional cross-correlation operator. Similarly, the variance map would be calculated as
|
𝒩2=1[1/σ2(x,y)]⊗[P2(x,y)]. | (10) |
This operation is equivalent to calculating the maximum-likelihood fit of the PSF centered over every pixel in the map, taking into account the noise. Presently P is simply modeled as an ideal Gaussian with a FWHM set to the diffraction limit of the telescope.
However, since there is large-scale (and therefore correlated from pixel to pixel) noise, the recipe also has an additional step. It first smooths the map by cross-correlating with a larger Gaussian kernel to estimate the background, and then subtracts it from the image. The same operation is also applied to the PSF to estimate the effective shape of a point-source in this background-subtracted map.
Before applying the filter to our cosmology data, we first look at the effect it has on the map of Uranus
from Fig. 9. We create a simple parameter file called smooth.ini,
where SMOOTH_FWHM = 15 indicates that the background should be estimated by first smoothing the
map and PSF with a 15 arcsec FWHM Gaussian. Next, the recipe is executed as follows:
The output of this operation is a smoothed image called uranus_mf.sdf. By default, the recipe
automatically normalizes the output such that the peak flux densities of point sources are conserved.
Note that the accuracy of this normalization depends on how closely the real PSF matches the
7.5 arcsec and 14 arcsec full-width at half-maximum (FWHM) Gaussian shapes assumed at
450 μm and
850 μm,
respectively (an explicit PSF can also be supplied using the PSF_MATCHFILTER recipe parameter).
The smoothed Uranus map is shown in Fig. 12. The map is generally flatter than the raw output of makemap, and the noise level is significantly reduced. However, the price that we pay for suppressing signal on scales larger than 15 arcsec is visible as the large negative ring around the source. For this particular case the dip is about 10 per cent of the peak signal. In addition to ringing, the filter attenuates the peak flux density of point sources. However, the normalization applies a positive correction to preserve peak flux densities, which results in an increased noise level.
Now that we know what this procedure does to a bright point source, we proceed to filter the map of MS0451:
The smoothed map, map450_mf.sdf, is shown next to Uranus in Fig. 12. As hoped, this map has most
of the remaining large-scale residual structure removed, and in general the noise is significantly
reduced.
Finally, how should we find sources? The filtered map also contains a VARIANCE component, so it is easy to produce a S/N map using the Kappa task makesnr:
The resulting map, map450_mf_snr, is shown in Fig. 13. Compared to Fig. 12 the edges no longer
appear as noisy because they have been down-weighted by the larger noise values where there were
less data.

A basic procedure for identifying sources would be to locate peaks above some threshold S/N. However, as a word of caution, even after all of these steps the noise may not be perfectly well-behaved. In this example we do not expect any real astronomical source, so the S/N map should have a brightness distribution that resembles a Gaussian with standard deviation σ=1 and mean zero. We perform this comparison for the central 100×100 pixels of the S/N map in Fig. 14, well away from any edge effects. In this case we find that the real distribution is slightly narrower than expected, suggesting that the noise has been mildly over-estimated.

We recognize that noise characterization is of utmost importance to the deep surveys, and we will continue to develop methods for estimating the true noise distributions in the final maps (e.g., using Monte Carlo simulations). Also, the Gaussian background noise suppression currently implemented in the matched-filter is isotropic. Clearly some of the residual large-scale noise has a preferred direction (such as the vertical stripes in Fig. 11). We are therefore investigating ways of automatically estimating more efficient filters for specific map geometries that will hopefully result in flatter maps, with reduced negative ringing around sources.
As a parting word on this subject, we mention some other tests that PIs should consider undertaking:
In this section we shall focus on the reduction of extended, Galactic sources. In the following example we produce a map of the Orion nebula from two observations (#22 & #23) taken on 16th February 2010. Two alternative methods will be used. The first is more cumbersome, but illustrates the use of Picard facilities for background removal, cropping, and mosaicking. The second method uses an alternative DIMM configuration aimed at maps of bright extended structures, and a single call to makemap.
If, as in this case, you have multiple observations contributing to your map, each observation can be reduced separately, and then combined to make the final map. Currently there is no advantage in terms of data quality to reducing all observations simultaneously or separately. However, the latter does allow the option of assessing the individual maps before coadding and is the method followed in this example.
When running the DIMM we select the default configuration file dimmconfig.lis; the individual
parameters of which are described in Section 4.

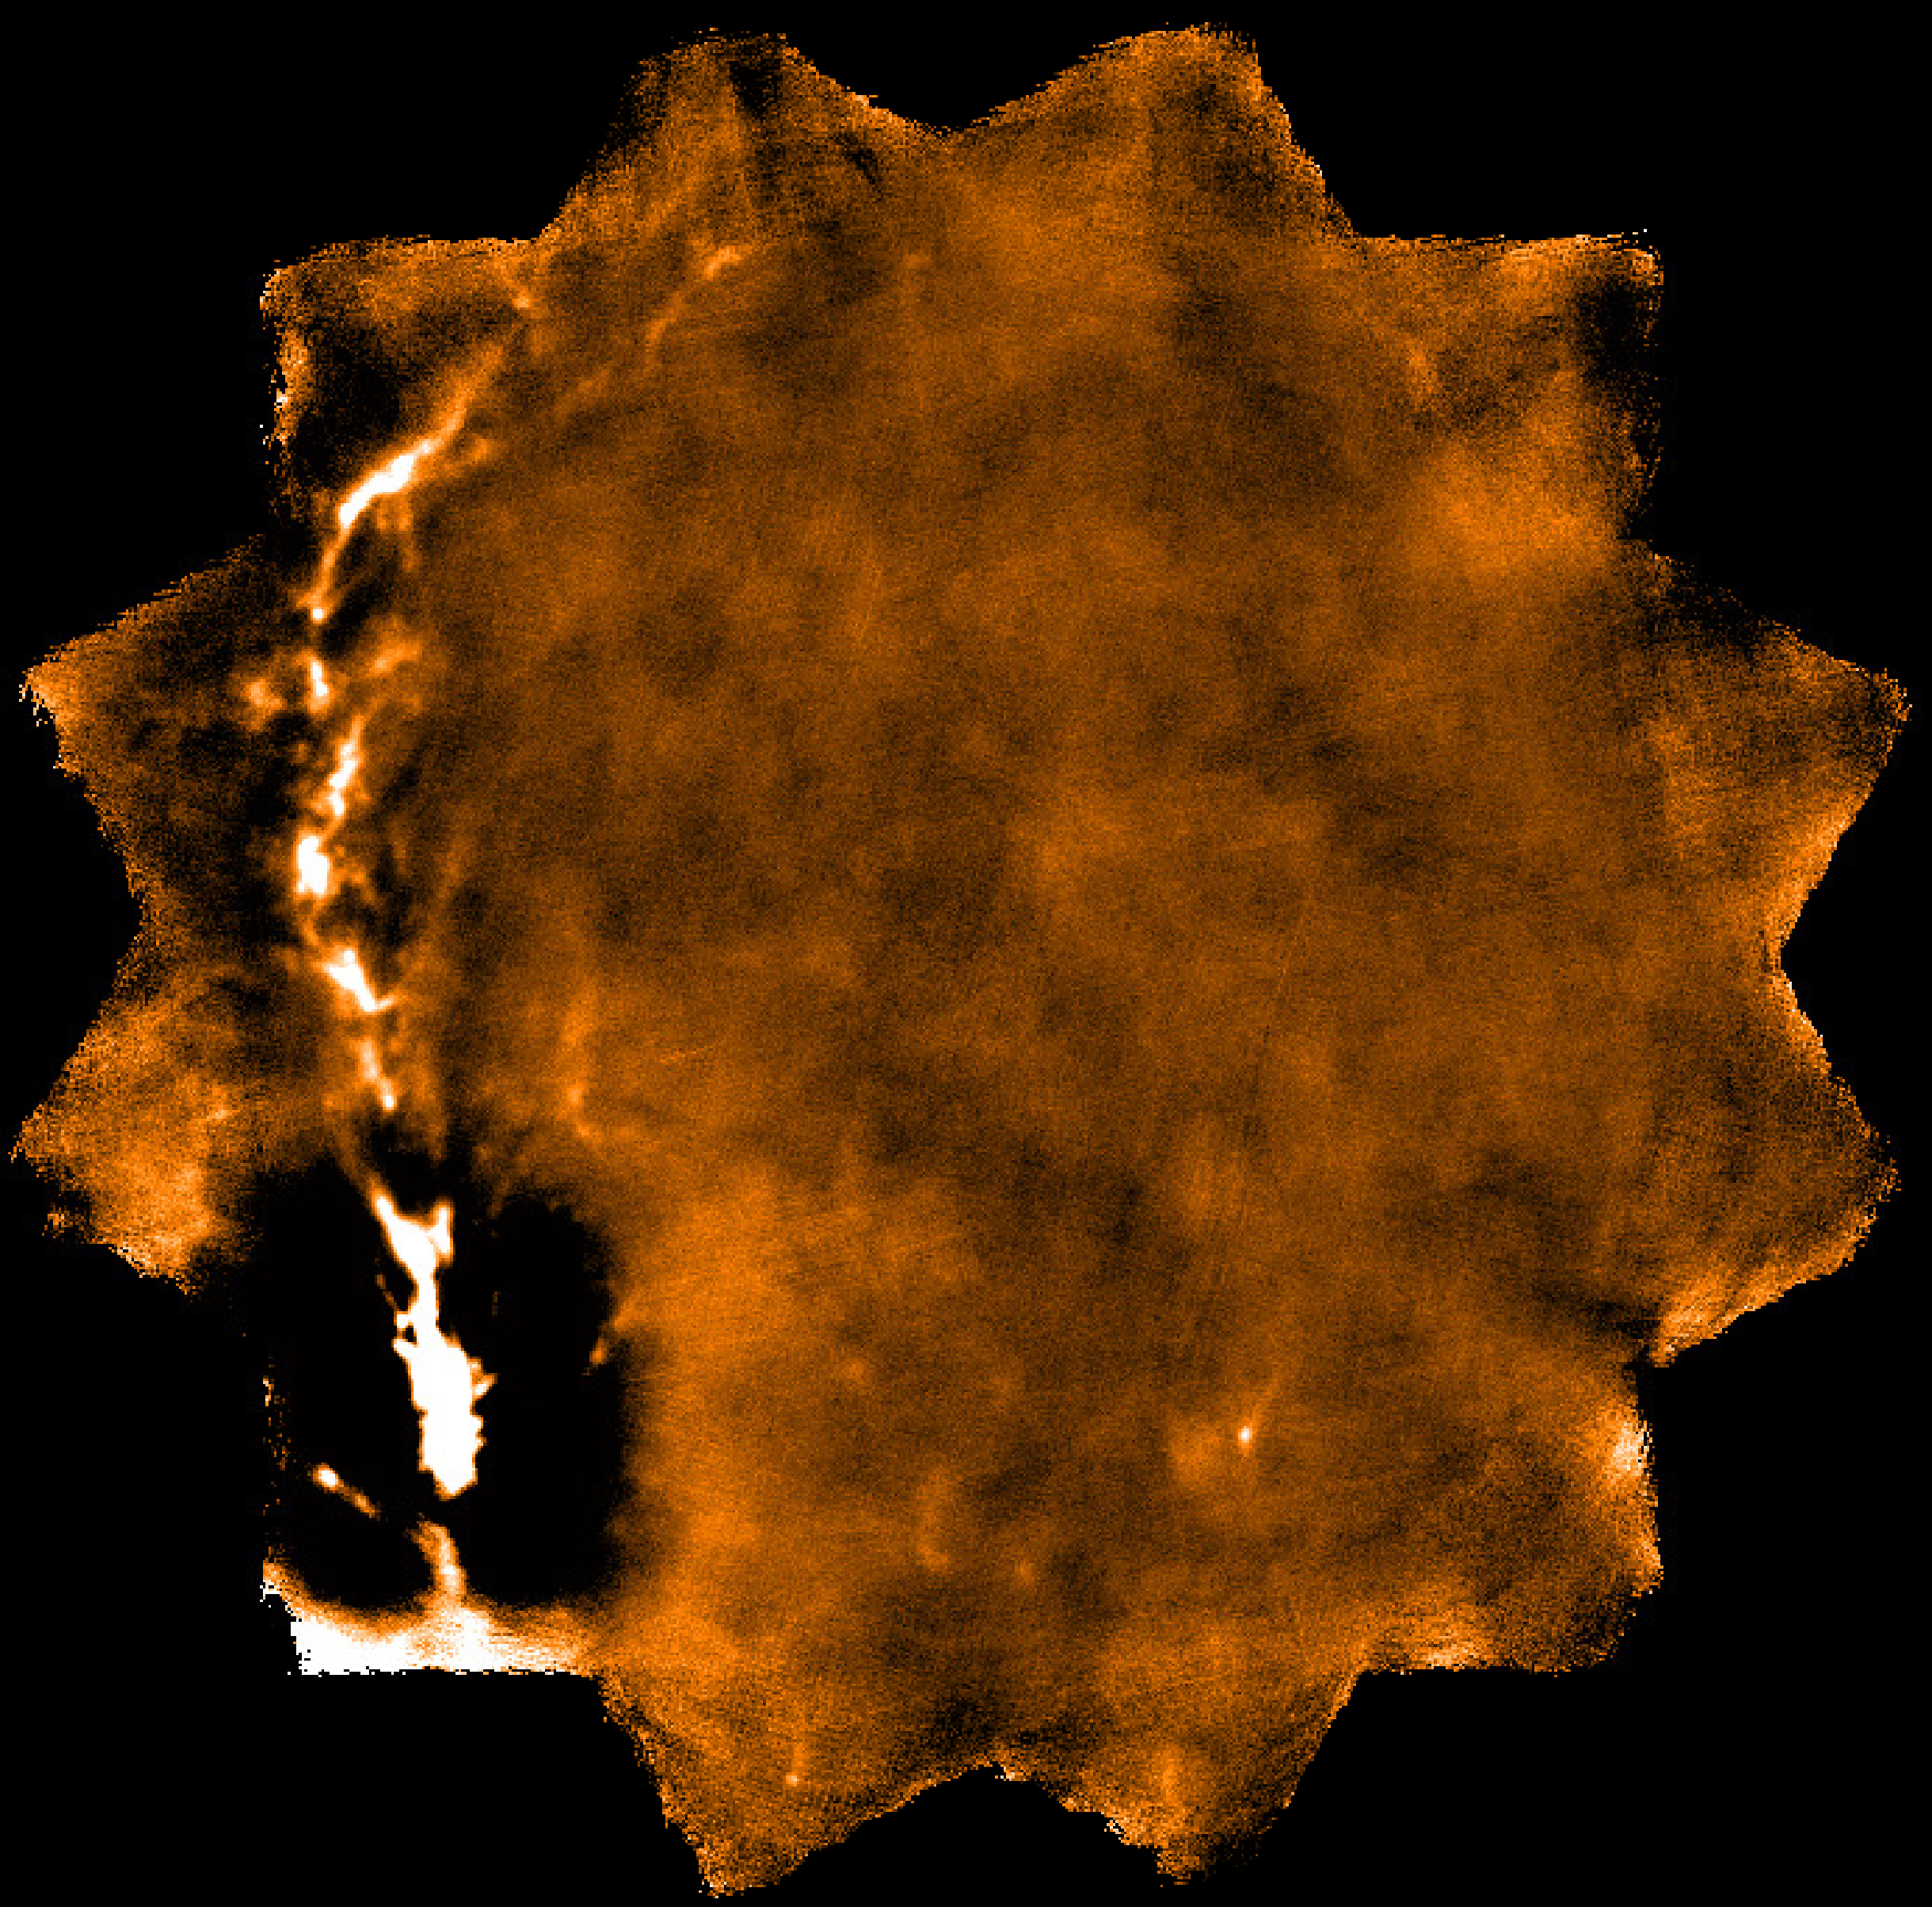
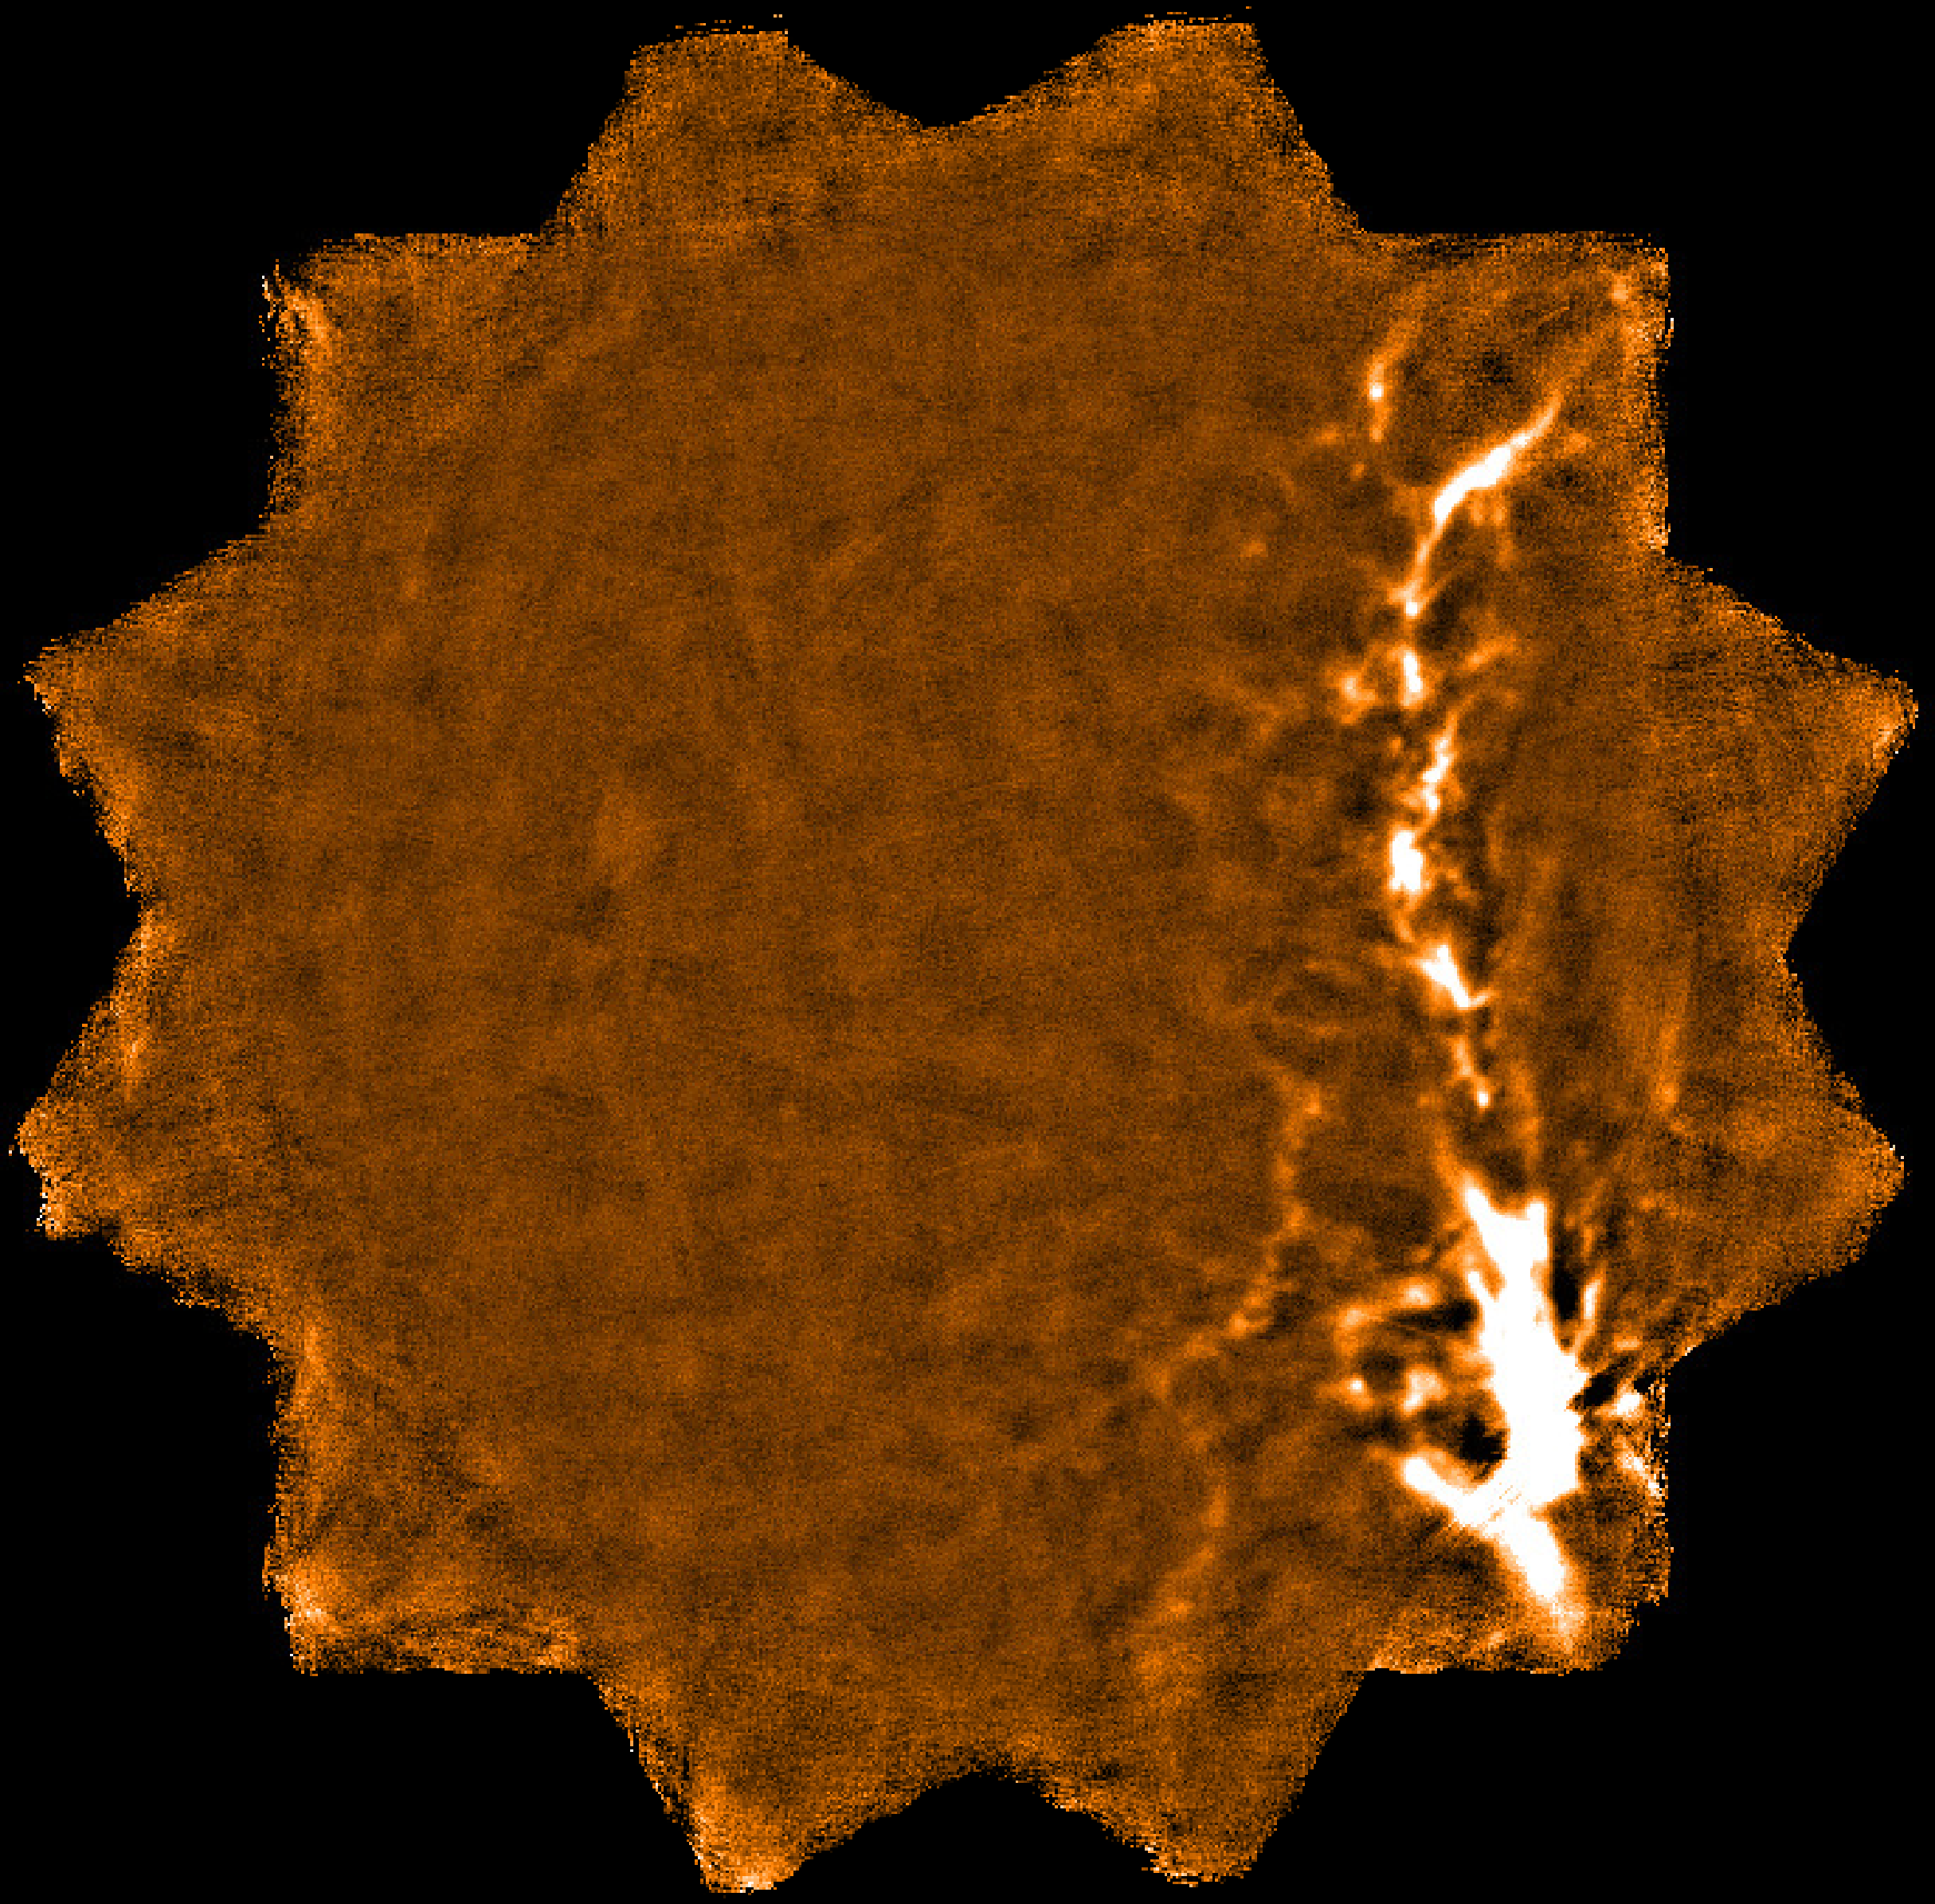
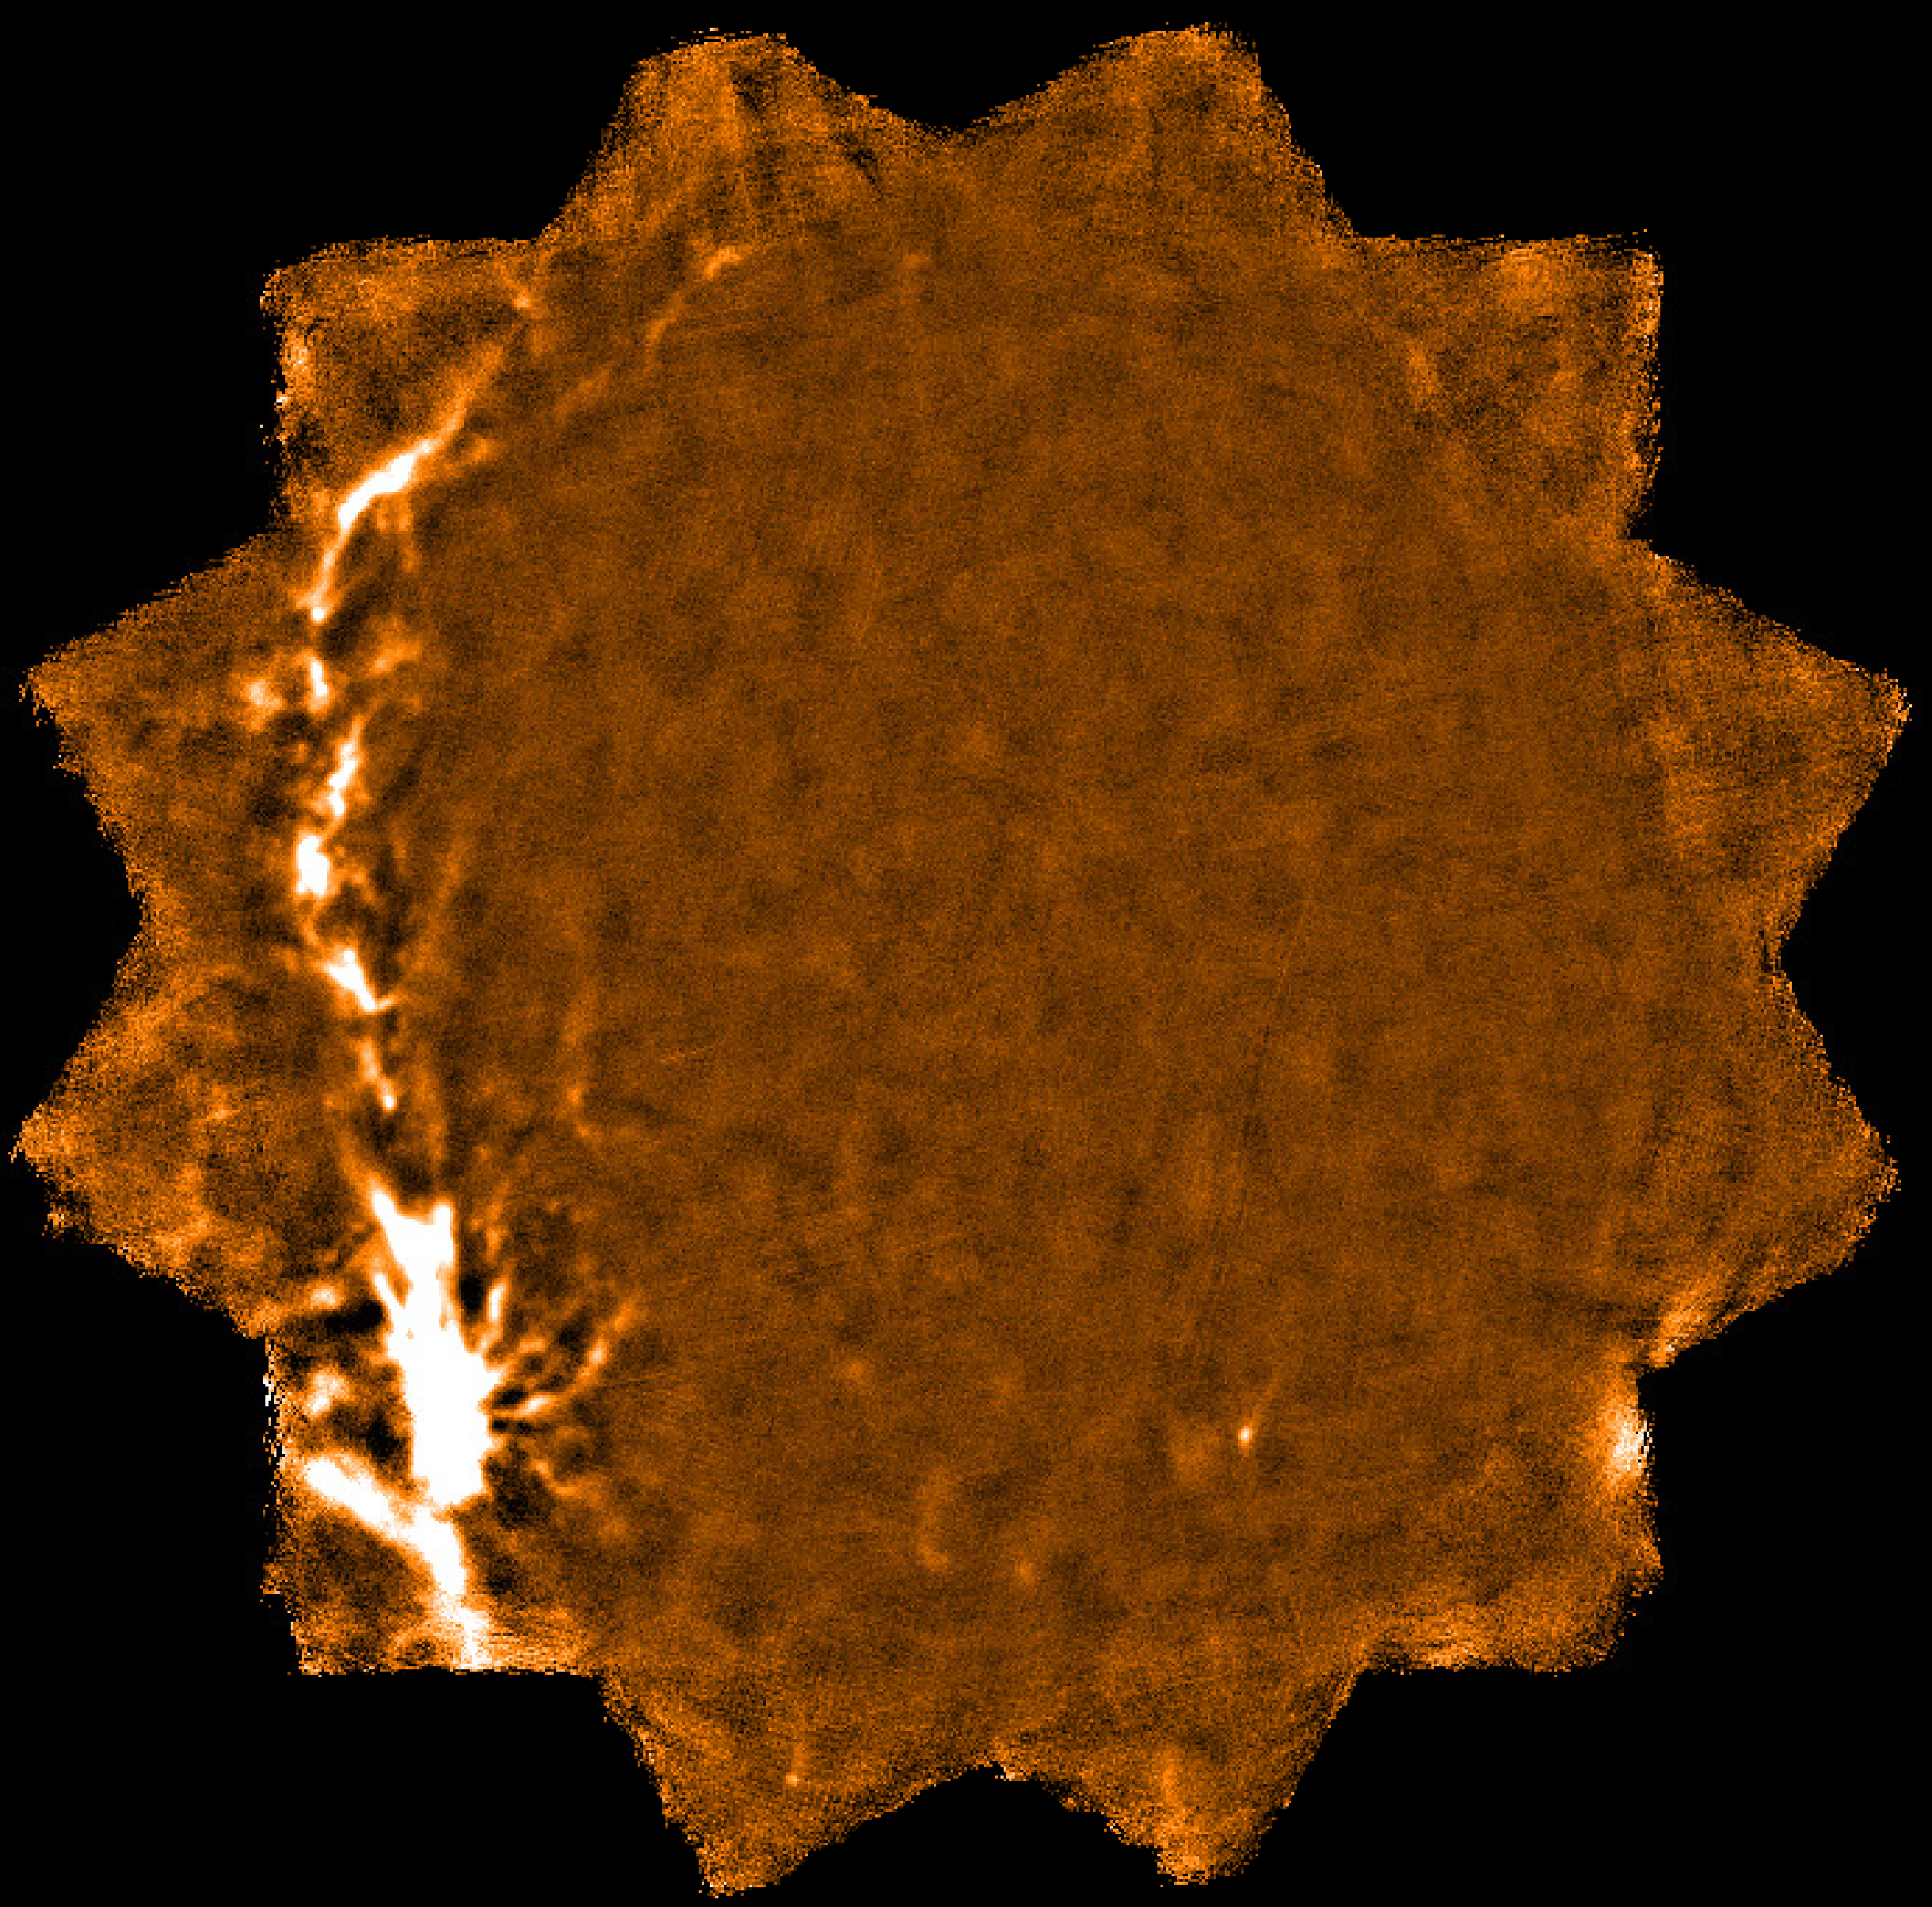
REMOVE_BACKGROUND using findback with a box
size of 30 pixels (120 arcsec).The map from each observation is shown on the top row of Fig. 15. Note that these maps were observed as a series of rotating pong patterns to avoid repetition of any scan direction, hence their distinctive shape.
The default configuration file is designed to preserve maximum flux, however the difficulty of distinguishing between low frequency noise and real extended source emission inevitably means that some low frequency noise ends up in the final map. The maps show that although extended emission has been recovered the background is far from flat, displaying large scale patchiness as well as deep negative bowling surrounding the strongest sources.
Both of these effects can be mitigated by post-processing using the Picard recipe REMOVE_BACKGROUND.
A number of different techniques are available in this recipe to control how the background is
removed. In this example we have selected Cupid findback which uses spatial filtering to remove
structure on a size scale less than that specififed by the parameter FINDBACK_BOX. The modified
parameter file (params.ini) is shown below where the method is set to findback and the
findback box size to 30 pixels or 120 arcsec when using 4 arcsec pixels:
Caution is advised when selecting the box size, with a smaller box giving a flatter background but at the expense of source flux. This is of particular importance to extended sources where the recovery of faint emission is paramount.
The background subtracted maps are shown on the bottom row of Fig. 15 where both the
bowling and uneven background have been significantly improved. Before we combine the
maps we will first crop them to their originally requested size using the Picard recipe
CROP_JCMT_IMAGES.
These cropped maps are then coadded using MOSAIC_JCMT_IMAGES. This example utilises the default
parameters where wcsmosaic with variance weighting is used for the mosaicking method although it
can be configured to use makemos or to use a different wcsmosaic method.
The key advantage to using the Picard recipe over standalone Kappa commands is that the exposure
time image is also propagated correctly to the output mosaic (it is stored in the .MORE.SMURF.EXP_TIME
extension).
The final, coadded map is shown in Fig. 16.
Note the output filename convention for each Picard recipe: REMOVE_BACKGROUND creates
output files with the suffix _back, CROP_JCMT_IMAGES creates files with the suffix _crop,
while MOSAIC_JCMT_IMAGES creates files with the suffix _mos appended to the last input
filename.
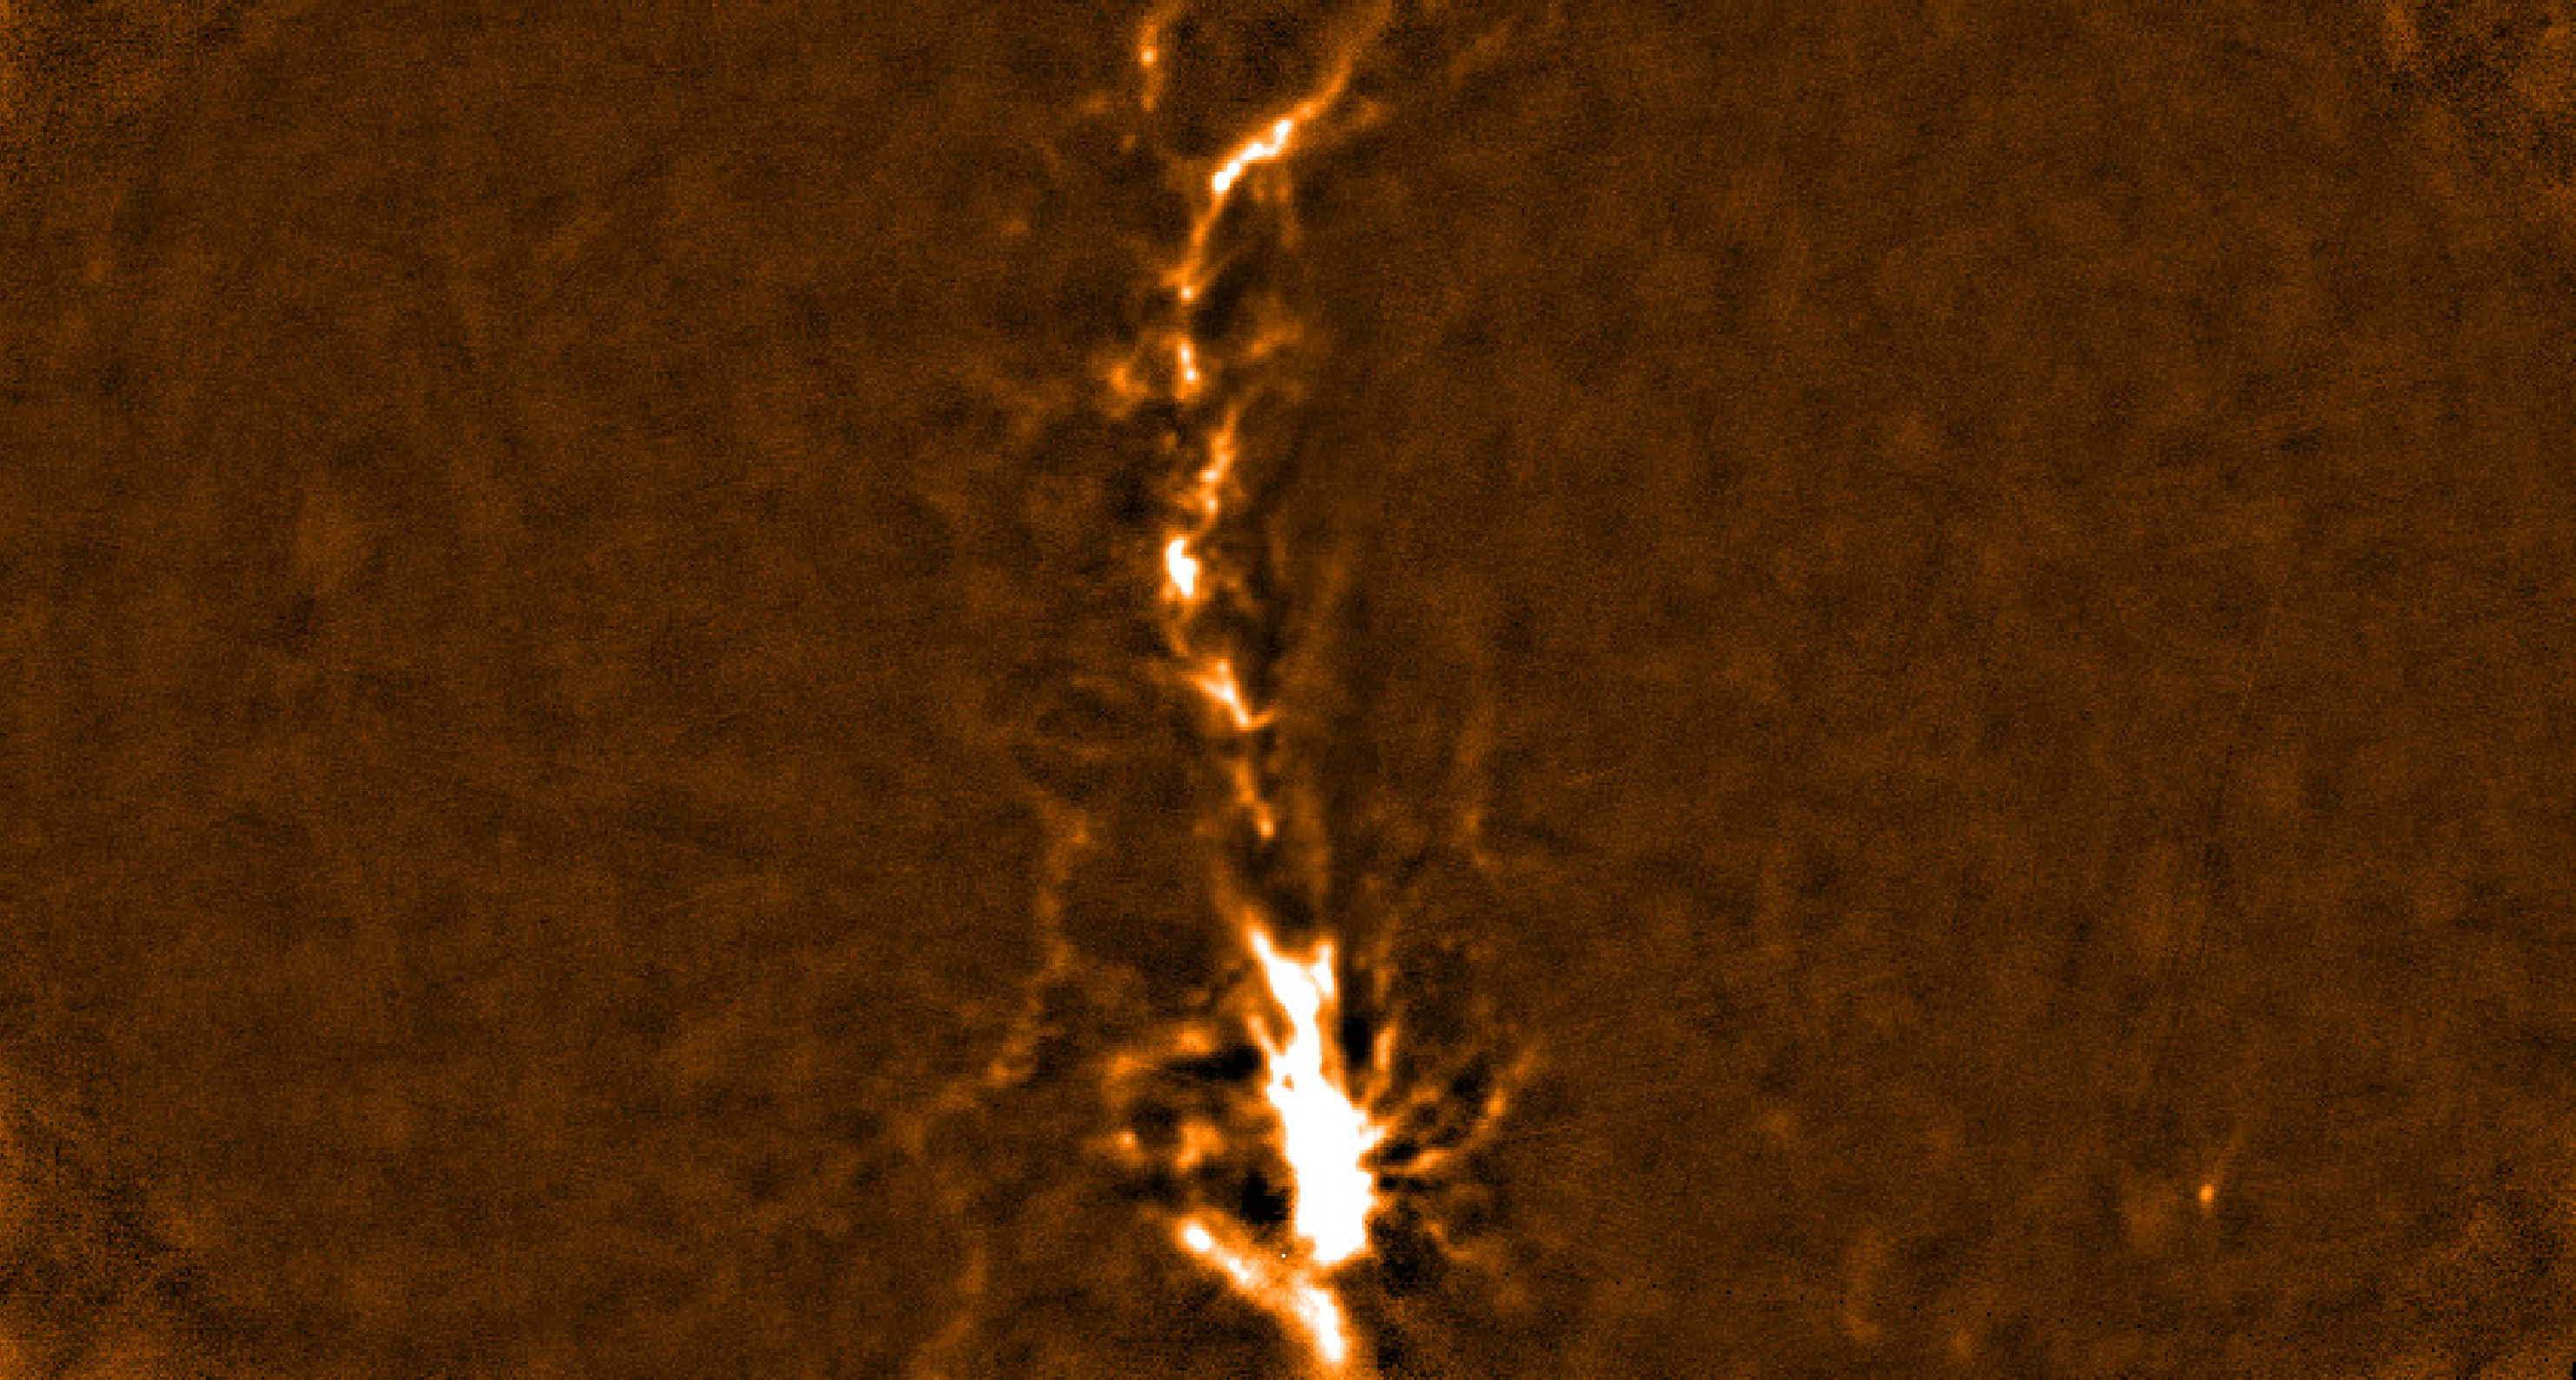
The simpler method is to make a map from all of the data at once using dimmconfig_bright_extended.lis:
The large-scale noise and negative bowling is compensated for using a S/N-based zero mask during map-making. Everywhere the signal is below this threshold (5-σ by default), the map is set to zero for all but the final iteration. The resulting map, and the location of the iteratively-determined zero mask are shown in Fig. 17.
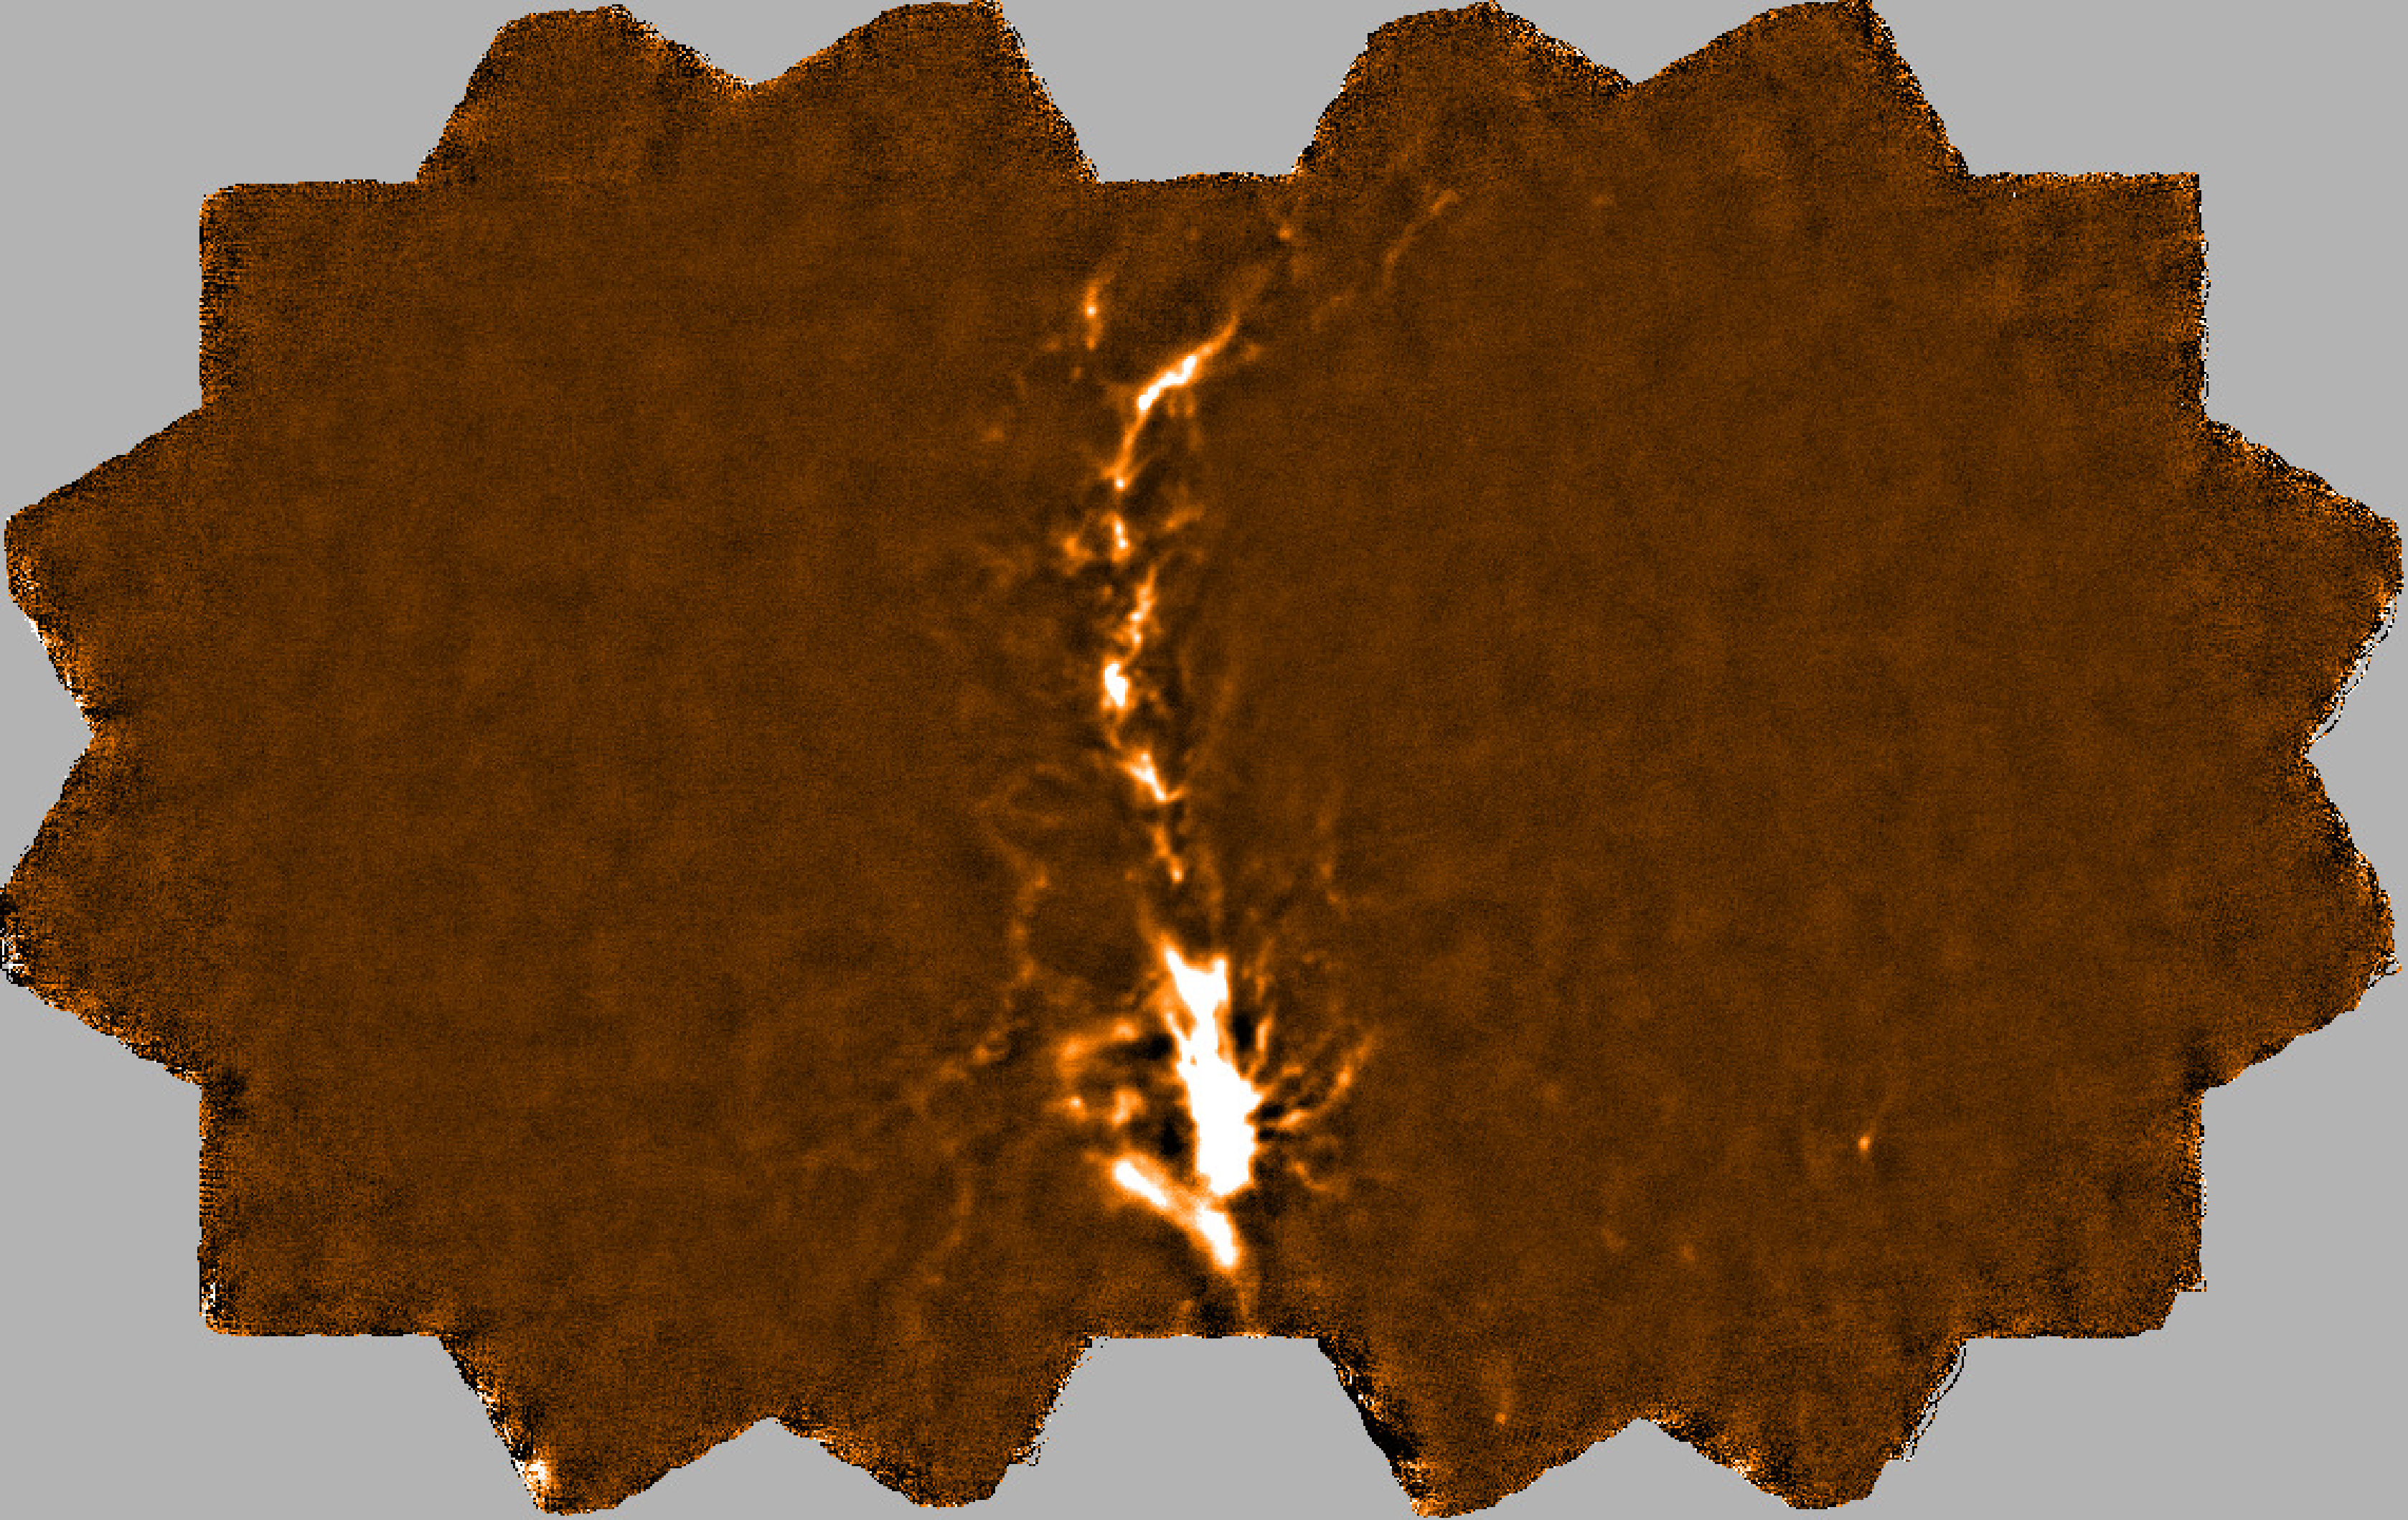

dimmconfig_bright_extended.lis.
Bottom: The QUALITY component of the resulting map indicates (white) where the map has
been constrained to zero after all but the final iteration. It is selected based on a S/N threshold.