
The pol2map tool for reducing POL-2 data was originally released for general science community use several years ago. The fact that its development remains ongoing directly reflects the continuing advances made at the cutting edge of POL-2 data reduction and analysis.
This advanced section of the POL-2 data reduction documentation aims to provide you with additional tools and options with which to refine your individual POL-2 data-reduction processes.
For further ideas, see Section 3.7.
If you receive additional data after an initial POL-2 reduction of a partial dataset, then it is almost always easier (and the process more robust) for you to simply re-run the reduction process ”from scratch” for the whole, augmented dataset. Despite the associated additional processor time cost, therefore, you are generally recommended to adopt this approach, rather than to attempt to combine new observations with pre-existing pol2map reduction products.
For completeness, however, this section describes the six-step process of combining data for one or more new POL-2 observations into existing , , and maps and vector catalogue created by an earlier run of pol2map.
MAPDIR, and then
add in the raw data files for the new observations. The auto-masked
maps have names that end in imap.sdf.
MASKOUT1 and MASKOUT2
parameters (see Step 3 in Section 3). To create the new masks that would be generated from the new
auto-masked map, use this command.
astmask.sdf and
astmasknew.sdf (and also
pcamask.sdf and pcamasknew.sdf).
Ensure that the new auto-masked co-add is used in place of the old one, in order to define any new masks needed in future:
Currently,the default map pixel size is 4′′ at both 850 and 450 µm. The pixel size is controlled by the PIXSIZE
parameter in the Smurf pol2map command.
The following four-step example shows how to investigate the impact of changing pixel size. In this example, 12′′ pixels and 7′′ pixels are compared.
iauto12.sdf file.
mask parameter value is enclosed in single and double
quotes).
Using larger pixels can sometimes encourage smooth blobs and other artificial features to appear in
the map. The iauto12.sdf file should be examined to check that it does not have such artificial
features.
Check the masks (astmask12.sdf and pcamask12.sdf) to make sure they look reasonable.
It is usually advisable to leave PIXSIZE at its default value and instead use the BINSIZE parameter to control the
bin size in the vector catalogue—see Section 4.6).
The error on the IP is reported to be of the order of 0.5%. It is possible to investigate the effects of the systematic error in IP by creating maps using the upper and lower limits on the IP value. The makemap configuration parameter called ipoffset can be used to conduct such an investigation. To use it, run pol2map twice, as follows.
This will produce maps using the upper and lower IP limits (a range of 0.5%). If pol2map has already been run
on POL-2 data, then a file will already exist that was created using the mean IP (the mean IP is
used if ipoffset is omitted from the configuration value, or the configuration parameter itself is
omitted).
Vector catalogues produced by pol2map contain information about World Coordinate Systems (WCS) in two different forms:
Starlink software such as Polpack, Kappa, and Gaia rely on the WCS FrameSet for all WCS-related operations (drawing annotated axes, aligning data sets, etc). Thus, problems are likely to arise if the WCS FrameSet is removed from the vector catalogue. This could happen if, for instance, inappropriate software is used to process an existing catalogue, creating a new output catalogue. Under such circumstances, the WCS FrameSet might not be copied to the output catalogue, causing subsequent WCS-related operations to fail. It is safe to use Polpack, Kappa, Gaia, and Cursa, as all these packages copy the WCS FrameSet to any new output catalogues. Unfortunately, the popular Topcat catalogue browser (see http://www.starlink.ac.uk/topcat/) and the STILTS package (http://www.starlink.ac.uk/stilts/) upon which it is based, do not copy the WCS FrameSet to any output catalogues.
For this reason, Polpack contains a command that can be used to copy the WCS FrameSet from one catalogue to
another. For example: a user creates the catalogue mycat.FIT using pol2map, uses Topcat to remove
low signal-to-noise vectors, and then saves the results to a new catalogue called selcat.FIT. The
WCS FrameSet would then be missing from selcat.FIT, and so it would be necessary to copy it
back into place again from the original catalogue file, mycat.FIT. To do this, run the “polwcscopy”
command.
This would create a third catalogue selcat2.FIT, which would be a copy of selcat.FIT, but with the WCS
information inherited from mycat.FIT.
If the MAPVAR=YES option is used when running the Smurf pol2map script, the I, Q, and U error estimates in the
resulting vector catalogue will be based on the spread of pixel values at each point on the sky in the
,
, and
maps made
from individual observations. Thus, if 20 observations are processed by pol2map to create a vector catalogue, then each
DI, DQ, or DU error estimate in the vector catalogue will be based on the spread of 20 independent measurements
of ,
, or
.
Even though 20 observations is a lot of POL-2 data, 20 is still a fairly small number from which to
produce an accurate estimate of the error. Consequently, it is usual to see a large level of random
“noise” on the error estimates, as in the following example, which shows the total-intensity
() error
estimates taken from a 12′′ vector catalogue near Ophiuchus L 1688 (Figure 6.1).

The uncertainty on the error estimate can cause some vectors that are clearly wrong (e.g. because they are very different from nearby vectors) to have anomalously low error estimates and so to be included in the set of “good” vectors (i.e. vectors that pass some suitable selection criterion based on the noise estimates).
One simple solution to this could be to apply some spatial smoothing to the error estimates. This would be a reasonable thing to do if there were no compact sources in the map. The errors close to a compact source are generally higher than those in a background region because of factors such as pointing errors and calibration errors. These factors cause a compact source to appear slightly different in each observation, and so cause higher error estimates in the vector catalogue. The above error estimates map shows this effect in the higher values at the very centre. Simply smoothing this map would spread that central feature out, artificially decreasing the peak error and increasing the errors in the neighbouring background pixels.
An alternative to smoothing is to split the total noise up into several different components, create a model of
each component, and then add the models together. The pol2noise script in Smurf enables the user to re-model
the noise estimates in a vector catalogue using such an approach. This facility is used by setting MODE=REMODEL
on the pol2noise command line:
This creates an output catalogue (newcat.FIT) holding a copy of the input catalogue (mycat.FIT),
and then calculates new values for all the error columns in the output catalogue. The new
,
, and
error
values are first derived from a three-component model of the noise in each quantity, and then errors for the
derived quantities (PI, P, and ANG) are found. New values of PI and P are also found using the specified
de-biasing algorithm. The file iext.sdf holds the total-intensity co-add map created by pol2map and is used to
define the total exposure time in each pixel. The re-modelled total-intensity error estimates are shown in
(Figure 6.2).

Most of the noise has gone without reducing the resolution. The script displays the original and re-modelled error estimates for each Stokes parameter (, , and ), the residuals between the two, and a scatter plot (Figure 6.3). The best-fitting straight lines through each scatter plot are also displayed.
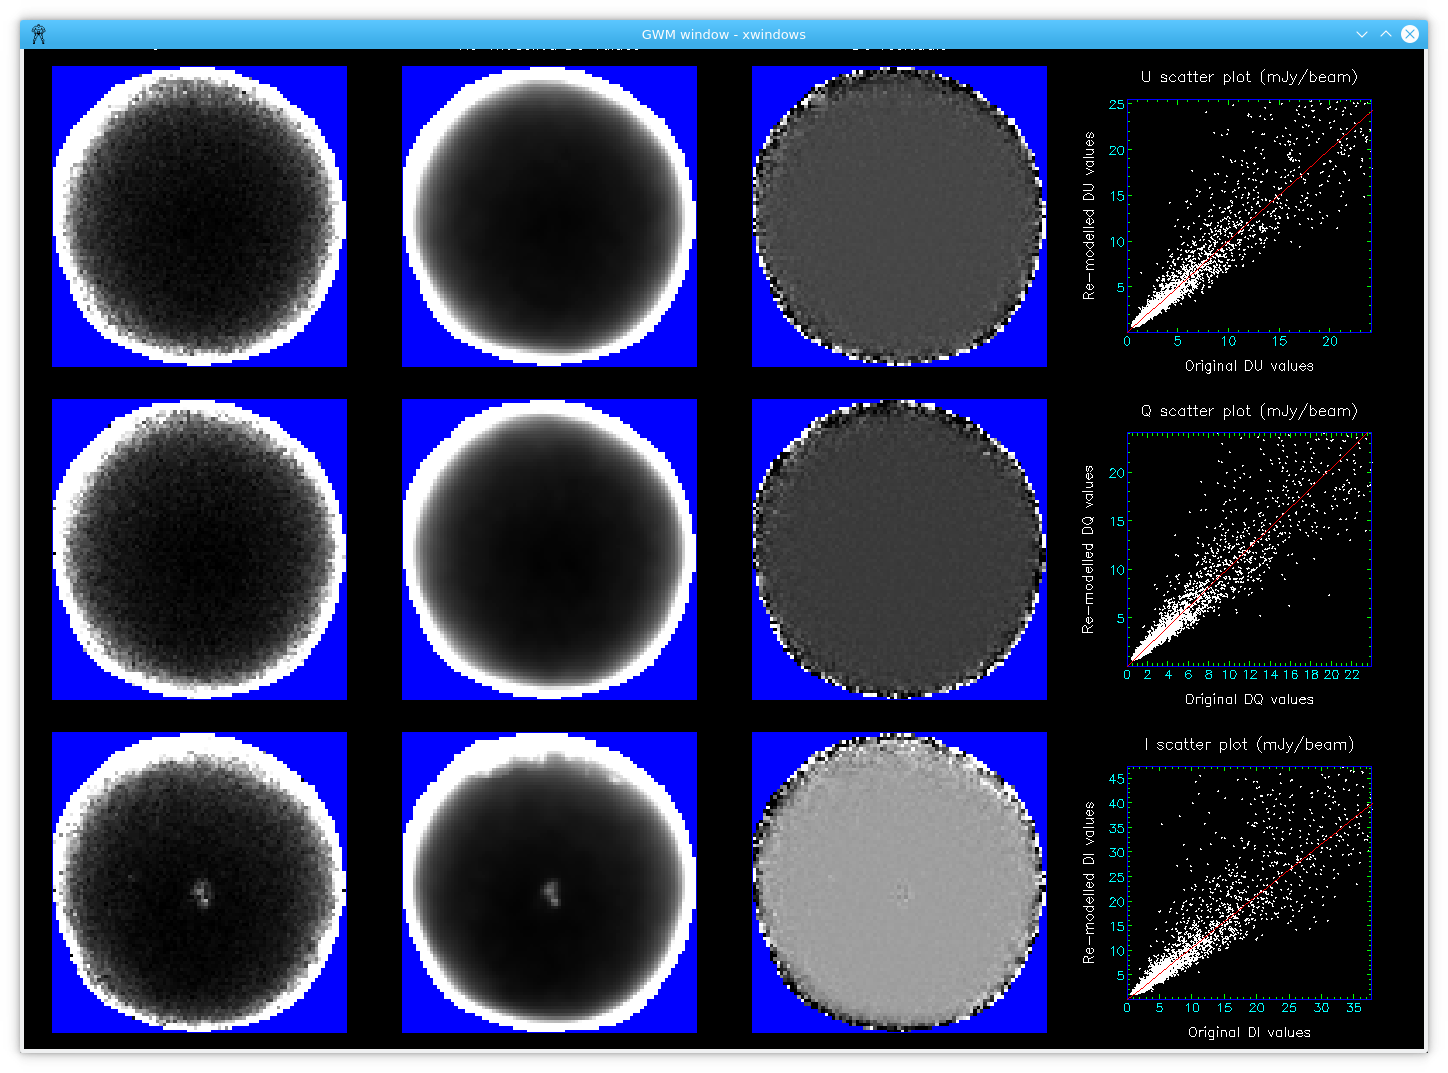
The three components used to model the error on each Stokes parameter(, , or ) are described below.
iext.sdf
in the above example). The background component is equal to ,
where
is the exposure time at each pixel, and
and
are constants determined by doing a linear fit between the log of the noise estimate in the catalogue
(DQ, DU, or DI) and the log of the exposure time (in practice,
is usually close to -0.5). The fit excludes bright source areas, but also excludes a thin rim around
the edge of the map where the original noise estimates are subject to large inaccuracies. Since the
exposure-time map is usually very much smoother than the original noise estimates, the background
component is also much smoother.
GaussClumps algorithm provided by the
findclumps command in the Starlink Cupid package. The noise residuals are first divided into
a number of “islands”, each island being a collection of contiguous pixels with noise residual
significantly higher than zero (this is done using the FellWalker algorithm in Cupid). The
GaussClumps algorithm is then used to model the noise residuals in each island. The resulting
model is smoothed lightly using a Gaussian kernel of FWHM 1.2 pixels.
The final model is the sum of the above three components. The new DI, DQ, and DU values are
found independently using the above method. The errors for the derived quantities (DPI, DP, and
DANG) are then found from DQ, DU, and DI using the usual error-propagation formulae. Finally
new P and PI values are found using a specified form of de-biasing (controlled by the Parameter
DEBIASTYPE).
The new poledit command in the Starlink Polpack package has an option to recalculate the PI (polarised
intensity) and P (percentage polarisation) values using a specified form of de-biasing. If the existing catalogue is
in file mycat.FIT, this can be done with the following commands.
This will create a new file, newcat.FIT, containing a copy of mycat.FIT, but with new P and PI columns
re-calculated from the existing Q, U, I, and DPI values using the “Modified Asymptotic” (MAS) bias estimator
(any de-biasing used to create the original catalogue is ignored). The options for the DEBIASTYPE parameter
are:
Figure 6.4 shows the results of using the poledit command with the various DEBIASTYPE parameter options
listed above.
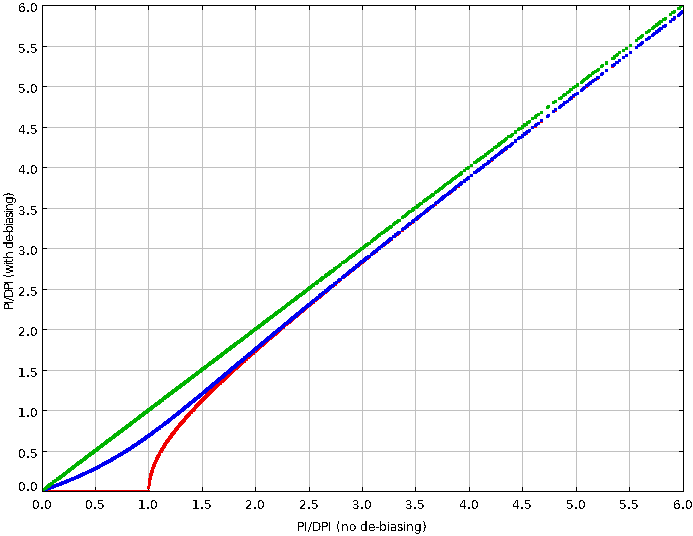
DEBIASTYPE options listed above (red is “AS”, blue is “MAS”, and green is
“None”). The pol2map script has a parameter, SMOOTH450, to enable the user to smooth 450 µm POL-2 maps to the
same resolution as their 850 µm counterparts. It is only accessed when processing 450 µm data, and
defaults to False, which results in no changes to the behaviour of pol2map. If SMOOTH450 is set to
True, pol2map performs an additional smoothing that results in the resolution of the resulting
,
, and
co-adds
(and the vector catalogue) being degraded to the resolution expected for 850 µm data. This allows 450 and 850
µm results to be compared more easily. A side-effect of the smoothing is that the noise levels in the final 450 µm
maps and catalogues is lower.
The smoothing is applied to the , , and maps made from each individual observation before using them to form the , , and co-adds. The same smoothing kernel is used for , , and and is formed by deconvolving the expected 850 µm beam shape using the expected 450 µm beam shape as the PSF (Point Spread Function). The “expected” beam shapes are two-component Gaussians as described in [10].
Figure 6.5 shows the effect of the SMOOTH450 on the mean radial total-intensity profile of 3C 279 determined
from 25 POL-2 observations. It can be seen that the smoothed 450 µm curve is very similar to the 850 µm
curve.
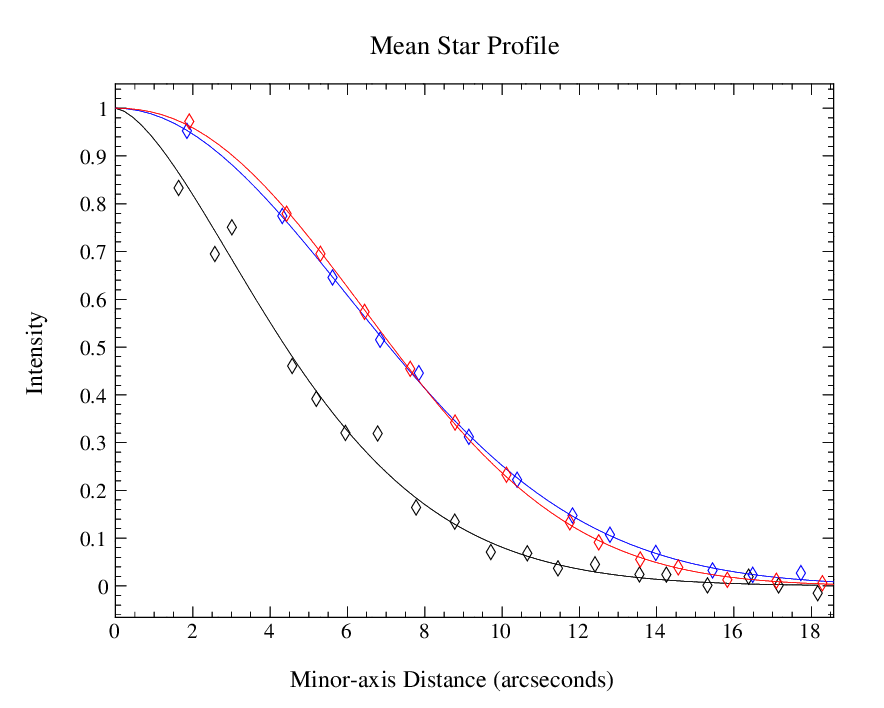
SMOOTH450 = NO (the default), the red curve
shows the 450 µm profile produced using SMOOTH450 = YES and the blue curve shows the 850 µm profile.
Figure 6.6 shows an example of the effect of the SMOOTH450 on a vector map for POL-2 observations of the
molecular cloud DR 21. The main difference is that there are many more red vectors than blue vectors. This is
because the smoothing introduced by SMOOTH450 has reduced the noise level, thus allowing more vectors to pass
the above selection criterion.
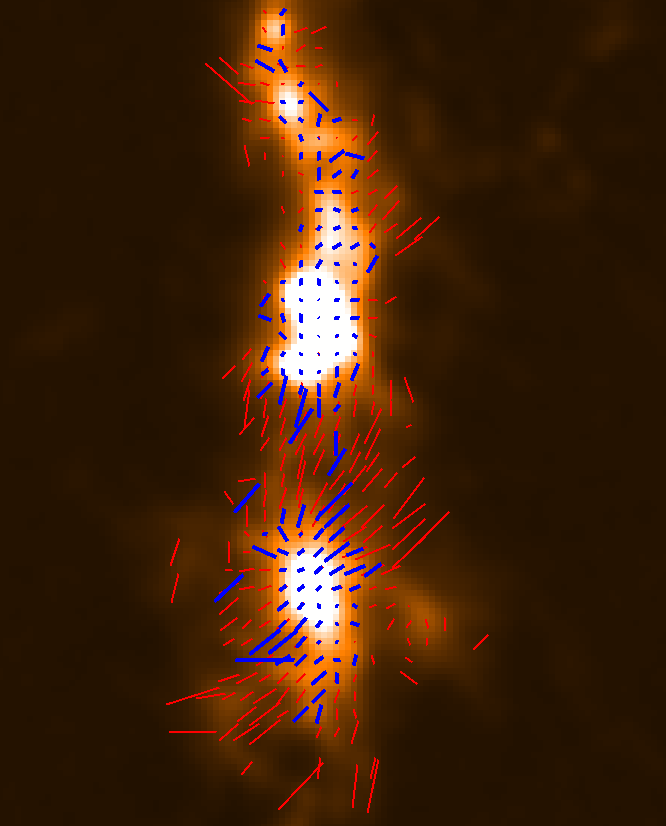
SMOOTH450 parameter. The blue vectors were created with SMOOTH450 = NO, and the red
vectors with SMOOTH450 = YES. Both red and blue used the same selection criterion (I>5*DI && DP <0.5
&& DANG < 10). As noted earlier, the map-making process used by the pol2map command uses two masks, each of which divides the field up into source and background regions.
Two separate masks are used because experience has shown that disruption of the PCA is caused mainly by the brighter central source regions. Consequently, the source regions within the PCA mask can be smaller than the source regions within the AST mask, as illustrated in Figure 6.7.
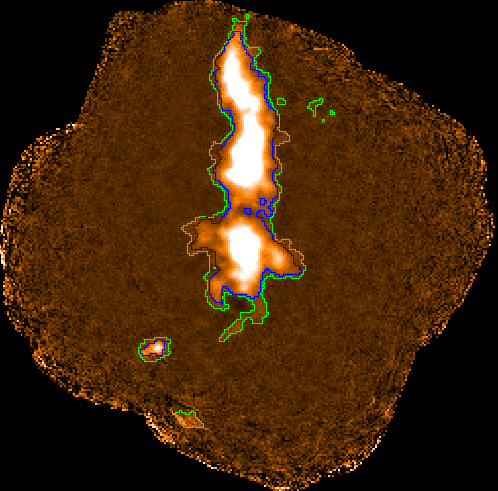
Default masks are created automatically by pol2map in a manner specified by the MASK parameter.
MASK is left at its default value of Auto, causing new
masks to be generated automatically at the end of each iteration of the map-making algorithm.
This “auto-masking” process identifies an initial set of sources by thresholding the current map
estimate at the SNR value specified by Configuration Parameter xxx.ZERO_SNR, where xxx is either
AST or PCA, depending on which mask is being generated. Each of these initial source regions
is then expanded to include adjoining pixels down to the SNR level specified by Configuration
Parameter xxx.ZERO_SNRLO.
MASK is set to the co-add of all the
total-intensity maps created at Step 1. The pol2map script first creates a pair of AST and PCA
masks from the supplied co-added map, and then uses these masks on all iterations of the map-making
algorithm 1.
The findclumps command in the Starlink Cupid package is used by pol2map to create the masks.
The process used by findclumps is the same as describe above for Step 1–initial sources are defined
by a fixed SNR threshold within the supplied co-add and these are then extended down to a
lower SNR threshold. The pol2map command sets these threshold values to the values of the
four configuration parameters listed above—AST.ZERO_SNR, AST.ZERO_SNRLO, PCA.ZERO_SNR, and
PCA.ZERO_SNRLO.
These configuration parameter all default to the following values specified in the pol2map script:
To investigate the effects of changing these values, new values can be supplied, using the CONFIG parameter of the pol2map
command 2.
Here is an example.
Any values not specified will retain their default values listed above.
When processing POL-2 data, it is important to know that the map-making algorithm converged correctly for all observations. This information is available in the pol2map log file, along with the rest of the makemap or skyloop output. However, the log file can be very long, and so finding the relevant information may not be straightforward, particularly for users unfamiliar with the screen output usually created by makemap or skyloop.
To help with this, a simple Python script called
pol2logcheck.py3
is available, which searches a specified pol2map log file for the relevant information and reports any
observations that did not converge. This can be used as in the following example.
To combine POL-2 observations for multiple overlapping fields, the best way to proceed is probably as follows4.
field1, field2, etc., to create the auto-masked maps and the ,
,
and
time-stream data for each field.
field2, field3, etc. If preferred, Steps 2 and 3 can be combined into a single
invocation of pol2map.
1For completeness, it should be mentioned that the COM and FLT models are also masked, in addition to the AST and PCA
models. At Step 1 (the auto-masking stage), the masking of COM and FLT is controlled by a similar set of configuration parameters
to those of AST or PCA, except that xxx becomes COM or FLT. At Steps 2 and 3 (the external-masking stages), the COM and
FLT models are masked using the PCA mask generated by findclumps, and so COM and FLT masking cannot be controlled
independently of the PCA mask.
2Note that prior to 2019 July 10, this method could only be used at Step 1 (the supplied settings were ignored if supplied at Steps 2 or 3). Later versions of pol2map do not suffer from this limitation—the supplied values are honoured at all steps.
3This script is available at https://www.eao.hawaii.edu/~dberry/pol2logcheck.py.
4This method requires the use of a Starlink build from 2019 June 9 or later.